Copyright © 2010-2024
Nagios Enterprises, LLC. All rights reserved.
Home Menu Overview
The Home menu is an administrative overview of all of the processes going on in Nagios XI. It is designed to give administrators and users immediate viewing of most important information in your monitoring setup. The Home menu is broken into six submenus:
Quickview
The Home Dashboard is the initial page loaded upon logging into Nagios XI.
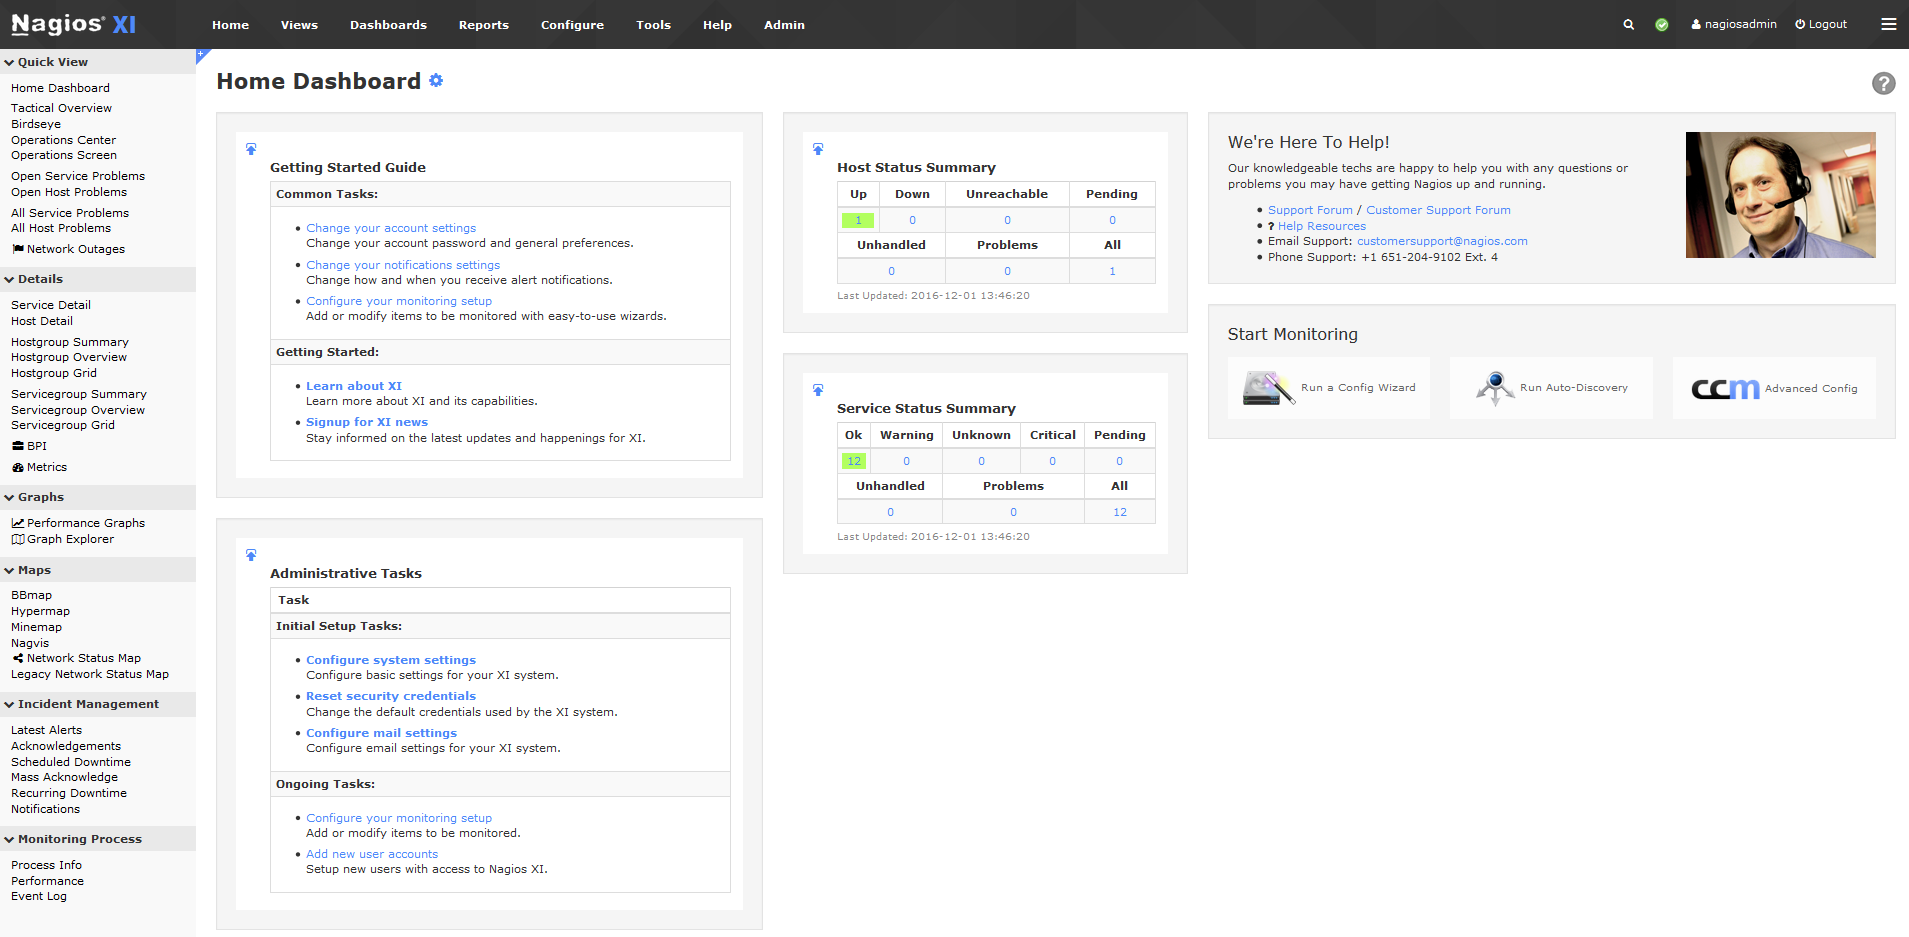
This is a customizable interface that contains different Dashlets, that can be added, deleted, and manipulated to best meet a user's needs. For a complete explanation on working with dashboards, see the documentation:
Understanding and Using XI Dashboards
The Tactical Overview is an overall summary of all hosts and services being monitored. It displays basic status for host and services, and an overall status for all of the systems being monitored.
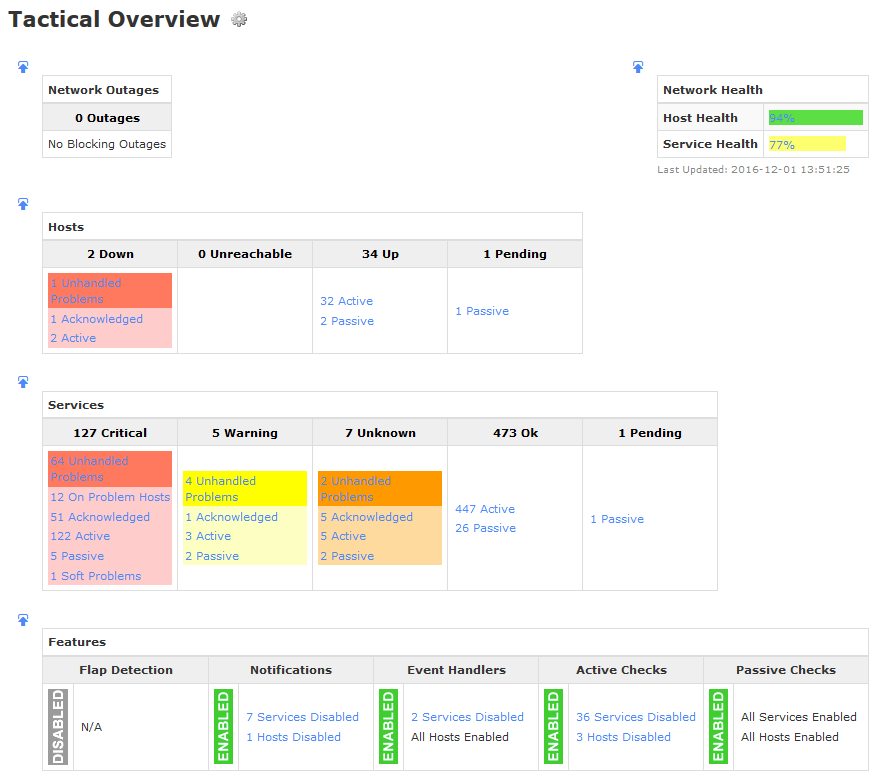
The following menus all gives status overviews for host or service problems that may need immediate attention.
- Open Service Problems
- Open Host Problems
- All Service Problems
- All Host Problems
- Network Outages
Details
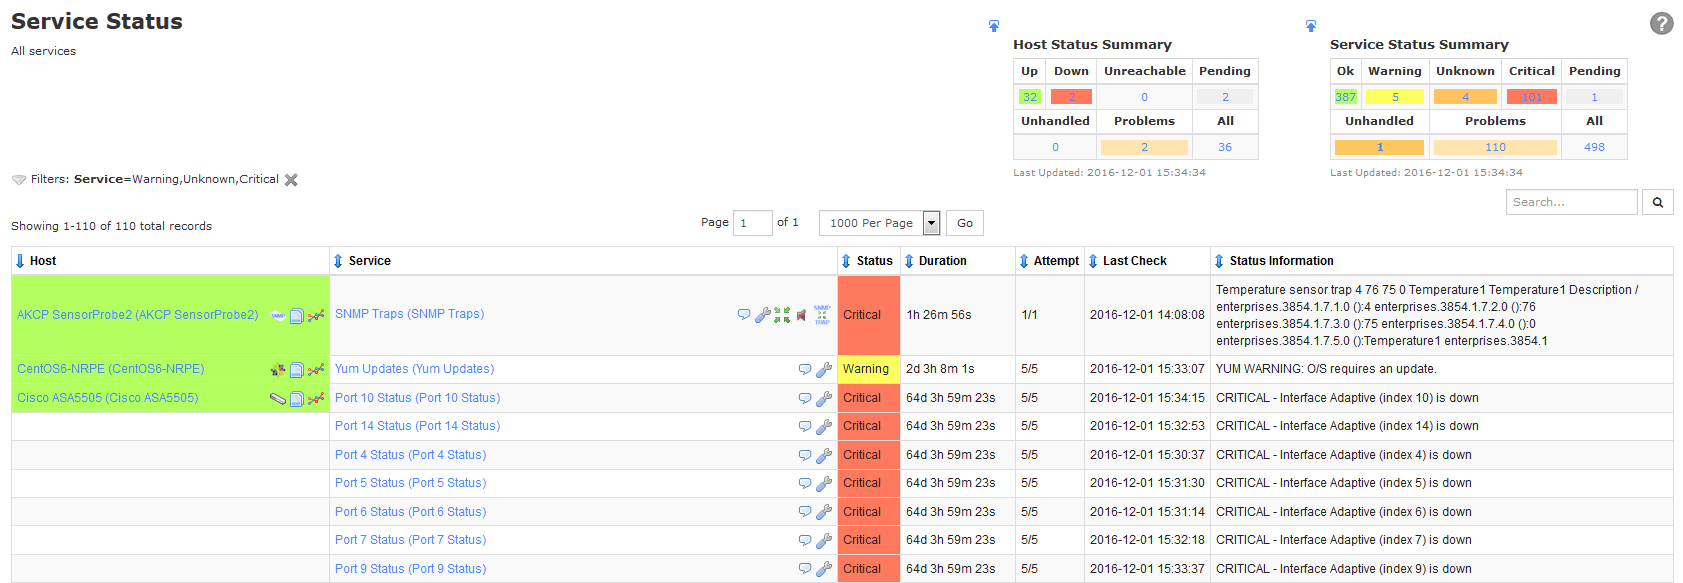
The Details menu contains summaries of all host and services being monitored by Nagios XI. The details menu allows you to take a closer look at all statistics, commands, and services running for each host.
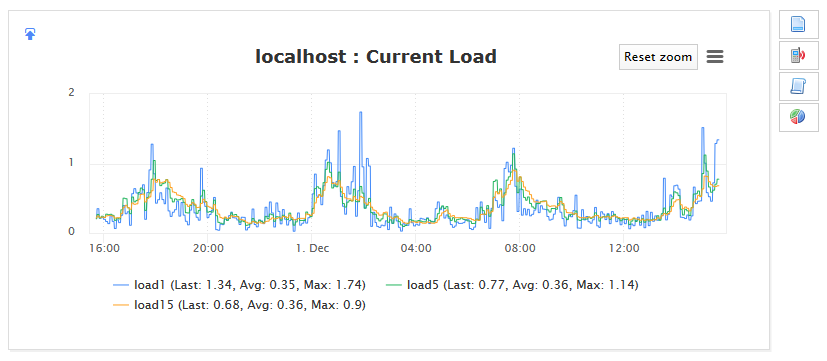
Performance Graphs
Nagios XI will generate a series of performance graphs for all applicable services being monitored for each host. The scale of these graphs can be changed by selecting the desired Time Selection for the monitoring period, ranging from 4 hours to 7 days.
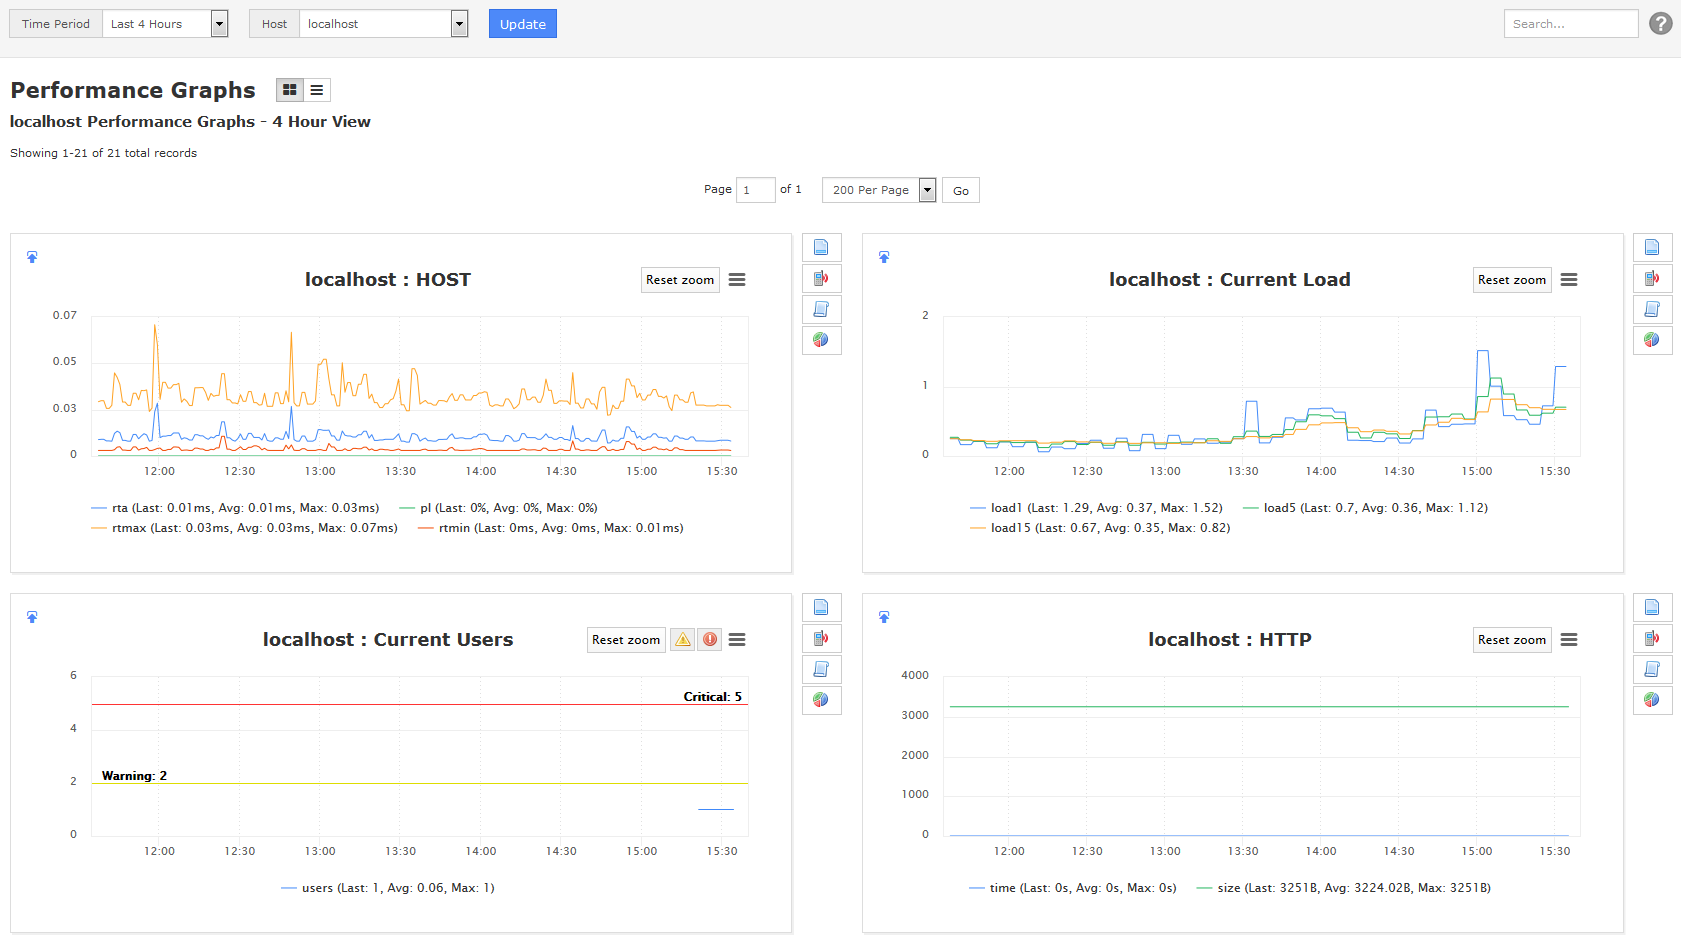
To view all of the graphs for a particular host, click on the graph for your desired host. Every graph also has additional details and statistics that can be accessing by clicking any of the icons located to the right of each graph.
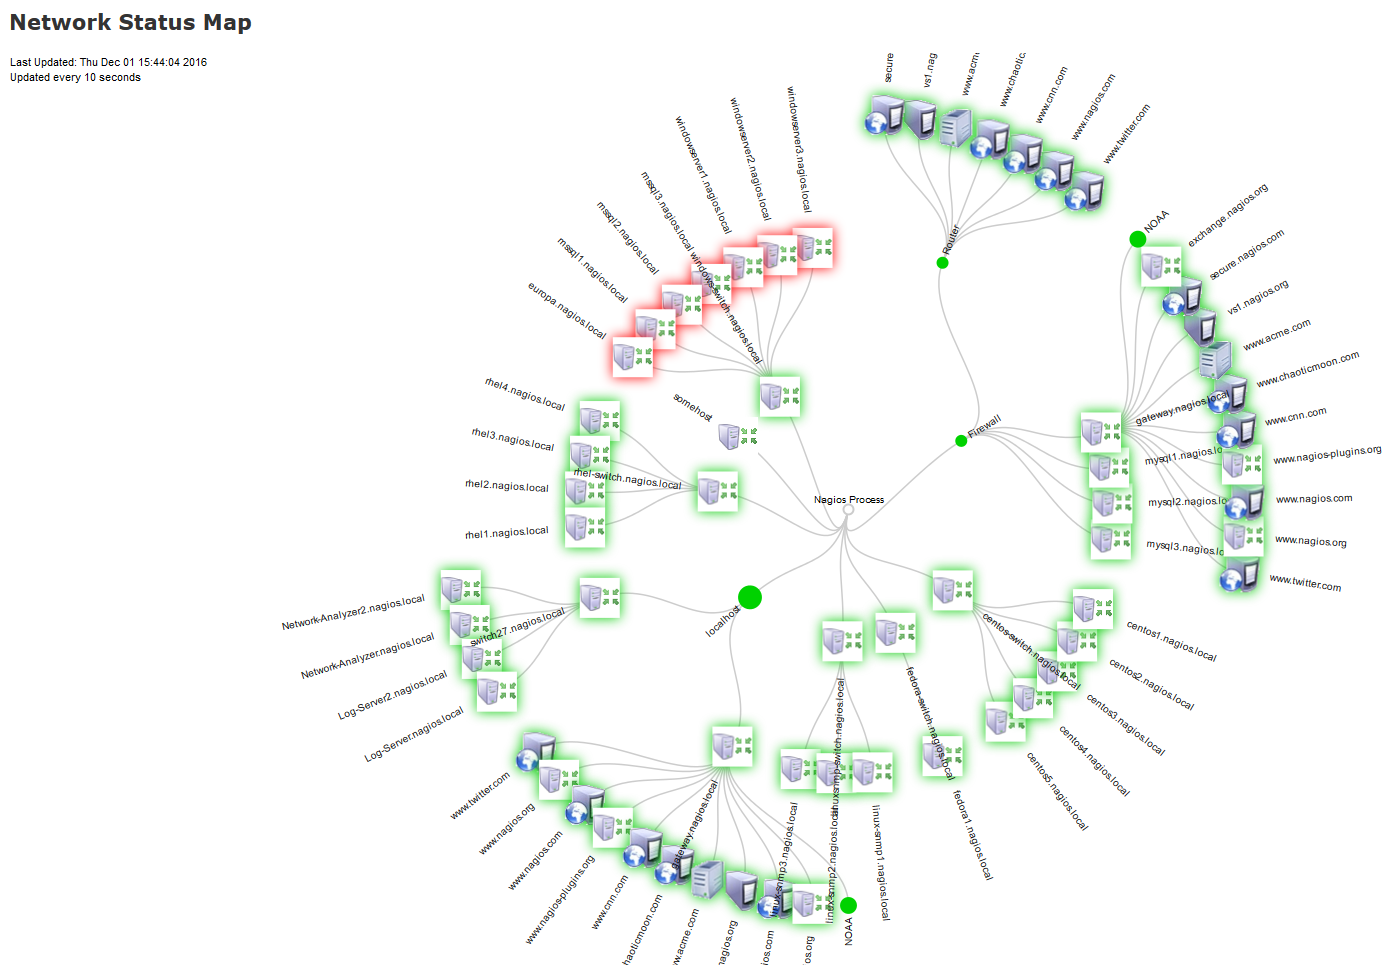
Maps
The Maps menu shows a graphical status map of all hosts, as well as any parent->child relationships that have been specified for the hosts. The status map can be viewed as a balloon or tree map. Additional plugins can also be installed for more mapping options.
Incident Management
The Incident Management menu is a compilation of all current notifications and acknowledgments for services and hosts.
- Acknowledgments: This page displays comments or acknowledgments for services and hosts.
- Scheduled Downtime: This page displays posts for scheduled service and host downtimes.
- Notifications: This page displays a list of the latest notifications found in the log file.
Monitoring Process
The Monitoring Process menu displays information about Nagios XI's internal processes. The process and performance tables can be added to a Dashboard for quick access.
- Process Info: This page displays information about the Nagios XI monitoring engine, showing what settings are enabled, as well as the monitoring engine event queue.
- Performance: This page displays statistics for Nagios XI's monitoring performance.
- Event Log: This page displays a printout of the Nagios XI event log file.
Views
Views are designed to provide individual users with quick access to Nagios XI pages and external websites they find useful. Views are often used by network administrators who wish to display important information on wall monitors in network operations centers (NOCs) or public locations. Views are specific to individual Nagios XI users. Each user can create their own unique set of views.
Dashboards
Dashboards are a powerful feature of Nagios XI designed to provide individual users with customized information they find useful. Dashboards are often used to display important, relevant information where it is needed most. Dashboards are specific to individual Nagios XI users. Each user can create their own unique set of dashboards to customize Nagios XI to fit their needs.
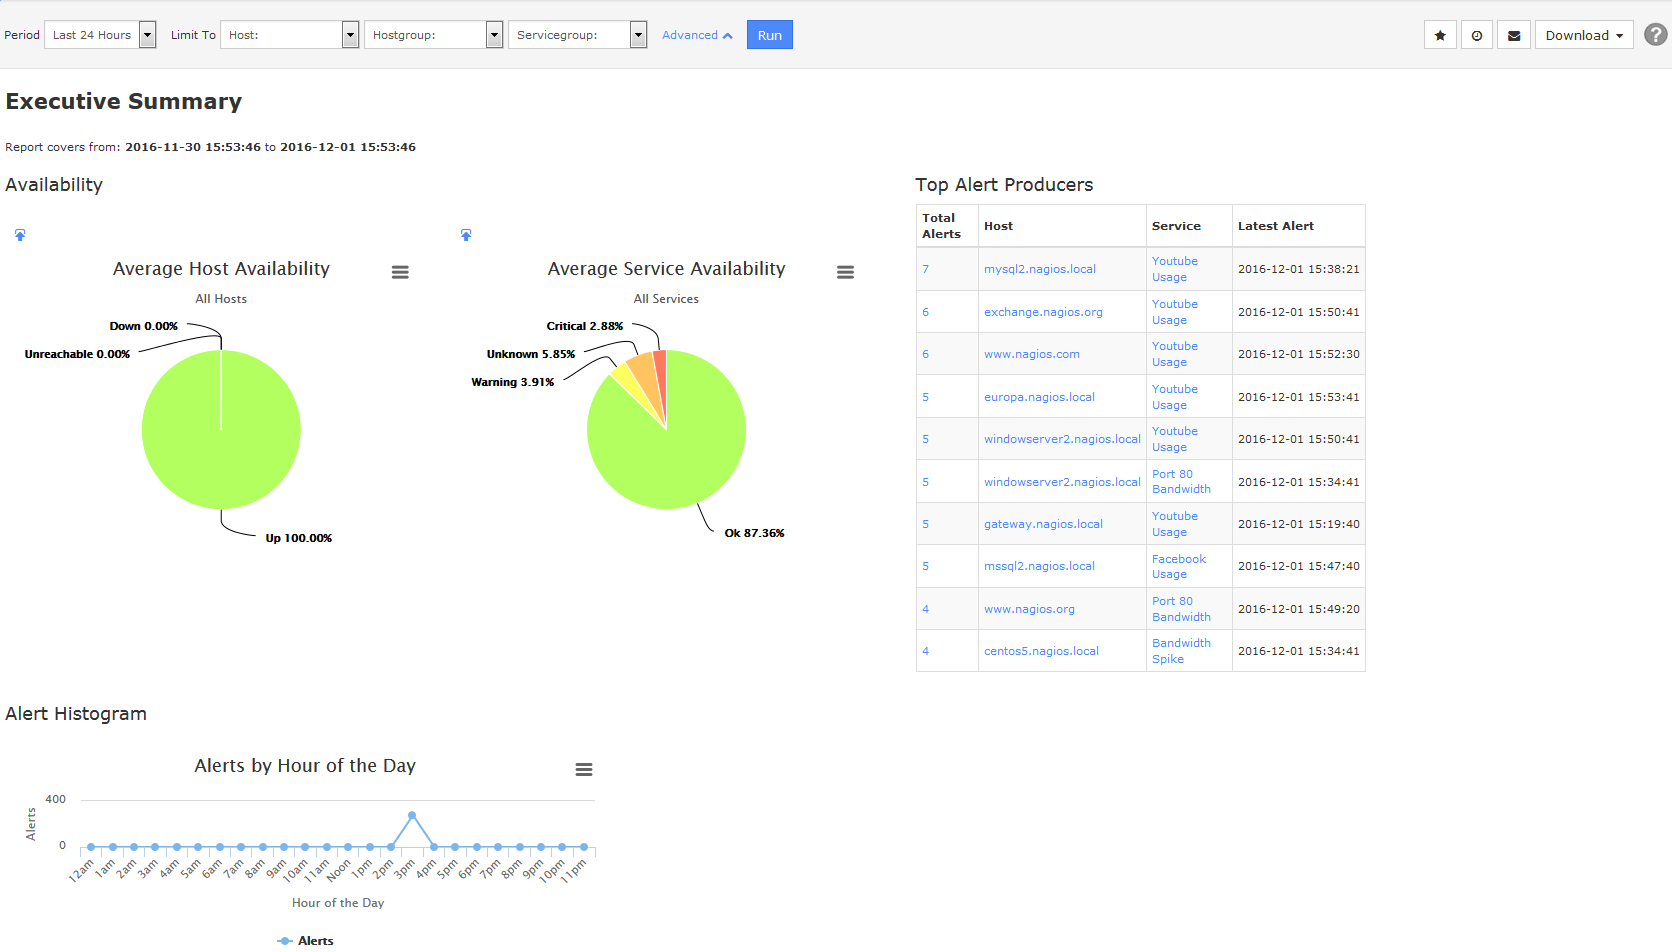
Reports
The Reports menu provides users with an easy way to generate statistics and graphical reports for hosts and services over a period of time. Reports are generated from a list of available wizards, and can be created for any host or service currently being monitored.
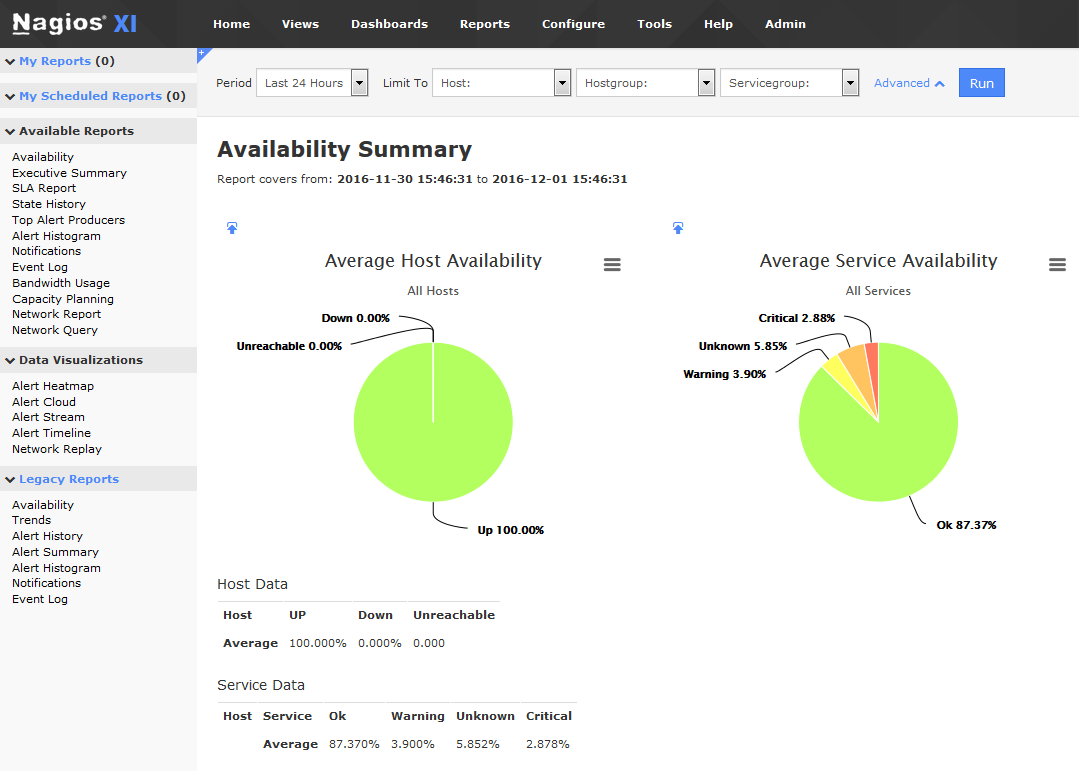
To create a report:
- Select the type of report
- Choose the Host(s) or Service(s)
- Specify the timeline and options for the report, and click the Create Report button
Configure
The Configure menu allows new monitoring processes to be setup by using the Monitoring Wizard. This wizard provides a step by step process for setting up new monitors for hosts and services.
Users can also manage their account settings such at their password and notification settings by selecting the Change Your Account Settings link.
For documentation on using the Core Config Manager and more advanced features, see the Nagios XI Administrator's Guide.
Help
The Help menu provides you with direct access to to Nagios XI support resources. The links located under the Help Resources menu will direct you to the following pages:
Additional Features
All of the pages within Nagios XI are accessed by a URL. The URL for any of the pages in Nagios XI can be accessed by clicking the Permalink icon located on the top right drop-down of the web interface. This will bring up a dialog box with the URL of the current page, which can be saved or bookmarked for later use.
Nagios XI also has a built in feedback feature, that allows you to send your feedback directly to Nagios development team. To access the feedback form, click on the Send Us Feedback icon located on the top right drop-down of the web interface.
Nagios XI has a large selection of addons and plugins that can be used to extend it's capabilities. For a complete list of available plugins, addons, and extensions; visit the Nagios Exchange website. For information on installing new components and plugins, see the Core Config Manager section in the Nagios XI Administrator's Guide.