Passive Checks
Need Help Configuring Nagios?
Our tech support team is happy to help you with any questions you might have. Contact us on our online support forum at https://support.nagios.com/forum/
Nagios XI Makes Monitoring Easier:
Nagios XI is the easy-to-use, enterprise version of Nagios that features:
- Web-Based Configuration provides advanced configuration features
- Monitoring Wizards make it easy to monitor new devices, applications, and services
- Customizable Dashboards allow for per-user customization
- Integrated Performance Graphs provide trending and capacity planning information
- Advanced Reports provide data insight and exporting capabilities
- Data Visualizations enable powerful analysis of patterns and problems
- Nagios Core Import functionality makes it easy to migrate from Nagios Core
- ... and many other features
Download a free 30-day trial to give Nagios XI a spin.
Inquire today and let our Quickstart team help you get started with Nagios XI
 Up To: Contents
 See Also: Active Checks, Service Checks, Host Checks
Introduction
In most cases you'll use Nagios Core to monitor your hosts and services using regularly scheduled active checks. Active checks can be used to "poll" a device or service for status information every so often. Nagios Core also supports a way to monitor hosts and services passively instead of actively. The key features of passive checks are as follows:
- Passive checks are initiated and performed by external applications/processes
- Passive check results are submitted to Nagios Core for processing
The major difference between active and passive checks is that active checks are initiated and performed by Nagios Core, while passive checks are performed by external applications.
Uses For Passive Checks
Passive checks are useful for monitoring services that are:
- Asynchronous in nature and cannot be monitored effectively by polling their status on a regularly scheduled basis
- Located behind a firewall and cannot be checked actively from the monitoring host
Examples of asynchronous services that lend themselves to being monitored passively include SNMP traps and security alerts. You never know how many (if any) traps or alerts you'll receive in a given time frame, so it's not feasible to just monitor their status every few minutes.
Passive checks are also used when configuring distributed or redundant monitoring installations.

How Passive Checks Work
Here's how passive checks work in more detail.
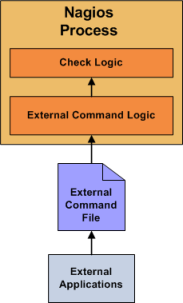
- An external application checks the status of a host or service.
- The external application writes the results of the check to the external command file.
- The next time Nagios Core reads the external command file it will place the results of all passive checks into a queue for later processing. Prior to Nagios Core 4, the same queue that was used for storing results from active checks was also used to store the results from passive checks.
- Nagios Core will periodically execute a check result reaper event and scan the check result queue. Each service check result that is found in the queue is processed in the same manner - regardless of whether the check was active or passive. Nagios Core may send out notifications, log alerts, etc. depending on the check result information.
The processing of active and passive check results is essentially identical. This allows for seamless integration of status information from external applications with Nagios Core.
Enabling Passive Checks
In order to enable passive checks in Nagios Core, you'll need to do the following:
- Set accept_passive_service_checks directive to 1.
- Set the passive_checks_enabled directive in your host and service definitions to 1.
If you want to disable processing of passive checks on a global basis, set the accept_passive_service_checks directive to 0.
If you would like to disable passive checks for just a few hosts or services, use the passive_checks_enabled directive in the host and/or service definitions to do so.
Submitting Passive Service Check Results
External applications can submit passive service check results to Nagios Core by writing a PROCESS_SERVICE_CHECK_RESULT external command to the external command file.
The format of the command is as follows:
[<timestamp>] PROCESS_SERVICE_CHECK_RESULT;<host_name>;<svc_description>;<return_code>;<plugin_output>
where ...
- timestamp is the time in time_t format (seconds since the UNIX epoch) that the service check was perfomed (or submitted). Please note the single space after the right bracket.
- host_name is the short name of the host associated with the service in the service definition
- svc_description is the description of the service as specified in the service definition
- return_code is the return code of the check (0=OK, 1=WARNING, 2=CRITICAL, 3=UNKNOWN)
- plugin_output is the text output of the service check (i.e. the plugin output)
Note: A service must be defined in Nagios Core before you can submit passive check results for it! Nagios Core will ignore all check results for services that had not been configured before it was last (re)started.
Tip: An example shell script of how to submit passive service check results to Nagios can be found in the documentation on volatile services.
Submitting Passive Host Check Results
External applications can submit passive host check results to Nagios Core by writing a PROCESS_HOST_CHECK_RESULT external command to the external command file.
The format of the command is as follows:
[<timestamp>] PROCESS_HOST_CHECK_RESULT;<host_name>;<host_status>;<plugin_output>
where ...
- timestamp is the time in time_t format (seconds since the UNIX epoch) that the host check was perfomed (or submitted). Please note the single space after the right bracket.
- host_name is the short name of the host (as defined in the host definition)
- host_status is the status of the host (0=UP, 1=DOWN, 2=UNREACHABLE)
- plugin_output is the text output of the host check
Note: A host must be defined in Nagios Core before you can submit passive check results for it! Nagios Core will ignore all check results for hosts that had not been configured before it was last (re)started.
Passive Checks and Host States
Unlike with active host checks, Nagios Core does not (by default) attempt to determine whether or host is DOWN or UNREACHABLE with passive checks. Rather, Nagios Core takes the passive check result to be the actual state the host is in and doesn't try to determine the host's actual state using the reachability logic. This can cause problems if you are submitting passive checks from a remote host or you have a distributed monitoring setup where the parent/child host relationships are different.
You can tell Nagios Core to translate DOWN/UNREACHABLE passive check result states to their "proper" state by using the translate_passive_host_checks variable. More information on how this works can be found here.
Note: Passive host checks are normally treated as HARD states, unless the passive_host_checks_are_soft option is enabled.
Submitting Passive Check Results From Remote Hosts

If an application that resides on the same host as Nagios Core is sending passive host or service check results, it can simply write the results directly to the external command file as outlined above. However, applications on remote hosts can't do this so easily.
In order to allow remote hosts to send passive check results to the monitoring host, you can use either the NSCA or NRDP addon. The NSCA addon consists of a daemon that runs on the Nagios Core hosts and a client that is executed from remote hosts. The daemon will listen for connections from remote clients, perform some basic validation on the results being submitted, and then write the check results directly into the external command file (as described above).
