TCP Wrapper Integration
Need Help Configuring Nagios?
Our tech support team is happy to help you with any questions you might have. Contact us on our online support forum at https://support.nagios.com/forum/
Nagios XI Makes Monitoring Easier:
Nagios XI is the easy-to-use, enterprise version of Nagios that features:
- Web-Based Configuration provides advanced configuration features
- Monitoring Wizards make it easy to monitor new devices, applications, and services
- Customizable Dashboards allow for per-user customization
- Integrated Performance Graphs provide trending and capacity planning information
- Advanced Reports provide data insight and exporting capabilities
- Data Visualizations enable powerful analysis of patterns and problems
- Nagios Core Import functionality makes it easy to migrate from Nagios Core
- ... and many other features
Download a free 30-day trial to give Nagios XI a spin.
Inquire today and let our Quickstart team help you get started with Nagios XI
 Up To: Contents
 See Also: Integration Overview, External Commands, Passive Checks

Introduction
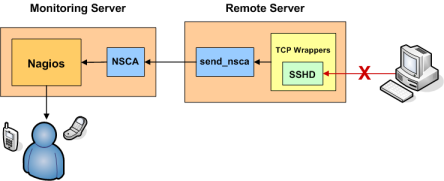
This document explains how to easily generate alerts in Nagios Core for connection attempts that are rejected by TCP wrappers. For example, if an unauthorized host attempts to connect to your SSH server, you can receive an alert in Nagios Core that contains the name of the host that was rejected. If you implement this on your Linux/Unix boxes, you'll be surprised how many port scans you can detect across your network.
These directions assume:
- You are already familiar with passive checks and how they work.
- You are already familiar with volatile services and how they work.
- The host which you are generating alerts for (i.e. the host you are using TCP wrappers on) is a remote host (called firestorm in this example). If you want to generate alerts on the same host that Nagios Core is running you will need to make a few modifications to the examples I provide.
- You have installed the NSCA daemon on your monitoring server and the NSCA client (send_nsca) on the remote machine that you are generating TCP wrapper alerts from.
Defining A Service
If you haven't done so already, create a host definition for the remote host (firestorm).
Next, define a service in one of your object configuration files for the TCP wrapper alerts on host firestorm. The service definition might look something like this:
define service {
    host_name                   firestorm
    service_description         TCP Wrappers
    is_volatile                 1
    active_checks_enabled       0
    passive_checks_enabled      1
    max_check_attempts          1
    check_command               check_none
    ...
}
There are some important things to note about the above service definition:
- The volatile option enabled. We want this option enabled because we want a notification to be generated for every alert that comes in.
- Active checks of the service as disabled, while passive checks are enabled. This means that the service will never be actively checked by Nagios Core - all alert information will have to be received passively from an external source.
- The max_check_attempts value is set to 1. This guarantees you will get a notification when the first alert is generated.
Configuring TCP Wrappers
Now you're going to have to modify the /etc/hosts.deny file on firestorm. In order to have the TCP wrappers send an alert to the monitoring host whenever a connection attempt is denied, you'll have to add a line similiar to the following:
ALL: ALL: RFC931: twist (/usr/local/nagios/libexec/eventhandlers/handle_tcp_wrapper %h %d) &
This line assumes that there is a script called handle_tcp_wrapper in the /usr/local/nagios/libexec/eventhandlers/ directory on firestorm. We'll write that script next.
Writing The Script
The last thing you need to do is write the handle_tcp_wrapper script on firestorm that will send the alert back to the Nagios Core server. It might look something like this:
#!/bin/sh
/usr/local/nagios/libexec/eventhandlers/submit_check_result firestorm "TCP Wrappers" 2 "Denied $2-$1" > /dev/null 2> /dev/null
Notice that the handle_tcp_wrapper script calls the submit_check_result script to actually send the alert back to the monitoring host. Assuming your Nagios Core server is called monitor, the submit check_result script might look like this:
#!/bin/sh
# Arguments
#   $1 = name of host in service definition
#   $2 = name/description of service in service definition
#   $3 = return code
#   $4 = output
/bin/echo -e "$1\t$2\t$3\t$4\n" | /usr/local/nagios/bin/send_nsca monitor -c /usr/local/nagios/etc/send_nsca.cfg
Finishing Up
You've now configured everything you need to, so all you have to do is restart the inetd process on firestorm and restart Nagios Core on your monitoring server. That's it! When the TCP wrappers on firestorm deny a connection attempt, you should be getting alerts in Nagios Core. The plugin output for the alert will look something like the following:
Denied sshd2-sdn-ar-002mnminnP321.dialsprint.net
