
Performance Data
Need Help Configuring Nagios?
Our tech support team is happy to help you with any questions you might have. Contact us on our online support forum at https://support.nagios.com/forum/
Nagios XI Makes Monitoring Easier:
Nagios XI is the easy-to-use, enterprise version of Nagios that features:
- Web-Based Configuration provides advanced configuration features
- Monitoring Wizards make it easy to monitor new devices, applications, and services
- Customizable Dashboards allow for per-user customization
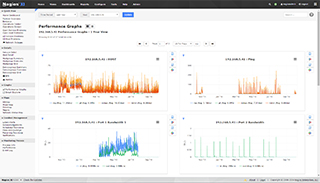
- Integrated Performance Graphs provide trending and capacity planning information
- Advanced Reports provide data insight and exporting capabilities
- Data Visualizations enable powerful analysis of patterns and problems
- Nagios Core Import functionality makes it easy to migrate from Nagios Core
- ... and many other features
Download a free 30-day trial to give Nagios XI a spin.
Inquire today and let our Quickstart team help you get started with Nagios XI
 Up To: Contents
 See Also: Plugins, Plugin API
Introduction
Nagios Core is designed to allow plugins to return optional performance data in addition to normal status data, as well as allow you to pass that performance data to external applications for processing. A description of the different types of performance data, as well as information on how to go about processing that data is described below...
Types of Performance Data
There are two basic categories of performance data that can be obtained from Nagios Core:
- Check performance data
- Plugin performance data
Check performance data is internal data that relates to the actual execution of a host or service check. This might include things like service check latency (i.e. how "late" was the service check from its scheduled execution time) and the number of seconds a host or service check took to execute. This type of performance data is available for all checks that are performed. The $HOSTEXECUTIONTIME$ and $SERVICEEXECUTIONTIME$ macros can be used to determine the number of seconds a host or service check was running and the $HOSTLATENCY$ and $SERVICELATENCY$ macros can be used to determine how "late" a regularly-scheduled host or service check was.
Plugin performance data is external data specific to the plugin used to perform the host or service check. Plugin-specific data can include things like percent packet loss, free disk space, processor load, number of current users, etc. - basically any type of metric that the plugin is measuring when it executes. Plugin-specific performance data is optional and may not be supported by all plugins. Plugin-specific performance data (if available) can be obtained by using the $HOSTPERFDATA$ and $SERVICEPERFDATA$ macros. Read on for more information on how plugins can return performance data to Nagios Core for inclusion in the $HOSTPERFDATA$ and $SERVICEPERFDATA$ macros.
Plugin Performance Data
At a minimum, Nagios Core plugins must return a single line of human-readable text that indicates the status of some type of measurable data. For example, the check_ping plugin might return a line of text like the following:
PING ok - Packet loss = 0%, RTA = 0.80 ms
With this simple type of output, the entire line of text is available in the $HOSTOUTPUT$ or $SERVICEOUTPUT$ macros (depending on whether this plugin was used as a host check or service check).
Plugins can return optional performance data in their output by sending the normal, human-readable text string that they usually would, followed by a pipe character (|), and then a string containing one or more performance data metrics. Let's take the check_ping plugin as an example and assume that it has been enhanced to return percent packet loss and average round trip time as performance data metrics. Sample output from the plugin might look like this:
PING ok - Packet loss = 0%, RTA = 0.80 ms | percent_packet_loss=0, rta=0.80
When Nagios Core sees this plugin output format it will split the output into two parts:
- Everything before the pipe character is considered to be the "normal" plugin output and will be stored in either the $HOSTOUTPUT$ or $SERVICEOUTPUT$ macro
- Everything after the pipe character is considered to be the plugin-specific performance data and will be stored in the $HOSTPERFDATA$ or $SERVICEPERFDATA$ macro
In the example above, the $HOSTOUTPUT$ or $SERVICEOUTPUT$ macro would contain "PING ok - Packet loss = 0%, RTA = 0.80 ms" (without quotes) and the $HOSTPERFDATA$ or $SERVICEPERFDATA$ macro would contain "percent_packet_loss=0, rta=0.80" (without quotes).
Multiple lines of performace data (as well as normal text output) can be obtained from plugins, as described in the plugin API documentation.
Note: The Nagios Core daemon doesn't directly process plugin performance data, so it doesn't really care what the performance data looks like. There aren't really any inherent limitations on the format or content of the performance data. However, if you are using an external addon to process the performance data (i.e. PerfParse), the addon may be expecting that the plugin returns performance data in a specific format. Check the documentation that comes with the addon for more information.
Processing Performance Data
If you want to process the performance data that is available from Nagios Core and the plugins, you'll need to do the following:
- Enable the process_performance_data option.
- Configure Nagios Core so that performance data is either written to files and/or processed by executing commands.
Read on for information on how to process performance data by writing to files or executing commands.
Processing Performance Data Using Commands
The most flexible way to process performance data is by having Nagios Core execute commands (that you specify) to process or redirect the data for later processing by external applications. The commands that Nagios Core executes to process host and service performance data are determined by the host_perfdata_command and service_perfdata_command options, respectively.
An example command definition that redirects service check performance data to a text file for later processing by another application is shown below:
define command {
    command_name    store-service-perfdata
    command_line    /bin/echo -e "$LASTSERVICECHECK$\t$HOSTNAME$\t$SERVICEDESC$\t$SERVICESTATE$\t$SERVICEATTEMPT$\t$SERVICESTATETYPE$\t$SERVICEEXECUTIONTIME$\t$SERVICELATENCY$\t$SERVICEOUTPUT$\t$SERVICEPERFDATA$" >> /usr/local/nagios/var/service-perfdata.dat
}
Tip: This method, while flexible, comes with a relatively high CPU overhead. If you're processing performance data for a large number of hosts and services, you'll probably want Nagios Core to write performance data to files instead. This method is described in the next section.
Writing Performance Data To Files
You can have Nagios Core write all host and service performance data directly to text files using the host_perfdata_file and service_perfdata_file options. The format in which host and service performance data is written to those files is determined by the host_perfdata_file_template and service_perfdata_file_template options.
An example file format template for service performance data might look like this:
service_perfdata_file_template=[SERVICEPERFDATA]\t$TIMET$\t$HOSTNAME$\t$SERVICEDESC$\t$SERVICEEXECUTIONTIME$\t$SERVICELATENCY$\t$SERVICEOUTPUT$\t$SERVICEPERFDATA$
By default, the text files will be opened in "append" mode. If you need to change the modes to "write" or "non-blocking read/write" (useful when writing to pipes), you can use the host_perfdata_file_mode and service_perfdata_file_mode options.
Additionally, you can have Nagios Core periodically execute commands to periocially process the performance data files (e.g. rotate them) using the host_perfdata_file_processing_command and service_perfdata_file_processing_command options. The interval at which these commands are executed are governed by the host_perfdata_file_processing_interval and service_perfdata_file_processing_interval options, respectively.