
Host and Service Check Scheduling
Need Help Configuring Nagios?
Our tech support team is happy to help you with any questions you might have. Contact us on our online support forum at https://support.nagios.com/forum/
Nagios XI Makes Monitoring Easier:
Nagios XI is the easy-to-use, enterprise version of Nagios that features:
- Web-Based Configuration provides advanced configuration features
- Monitoring Wizards make it easy to monitor new devices, applications, and services
- Customizable Dashboards allow for per-user customization
- Integrated Performance Graphs provide trending and capacity planning information
- Advanced Reports provide data insight and exporting capabilities
- Data Visualizations enable powerful analysis of patterns and problems
- Nagios Core Import functionality makes it easy to migrate from Nagios Core
- ... and many other features
Download a free 30-day trial to give Nagios XI a spin.
Inquire today and let our Quickstart team help you get started with Nagios XI
 Up To: Contents
 See Also: Active Checks
Introduction
This section explains how host and service checks are scheduled, along with how the scheduling differs from when the checks are actually executed and their results are processed. The options available for both host and service checks are the same, hence the documentation uses the common term "check" unless differentiation is required.
Configuration Options
Before we begin, there are several configuration options that affect how checks are scheduled, executed, and processed. For starters, each object definition contains three options that determine when and how each specific check is scheduled and executed. Those three options include:
- check_interval
- retry_interval
- check_period
There are also multiple configuration options in the main configuration file that affect checks. These include:
- host_inter_check_delay_method
- service_inter_check_delay_method
- service_interleave_factor
- max_concurrent_checks
We'll go into more detail on how all these options affect check scheduling as we progress. First off, let's see how objects are initially scheduled when Nagios first starts or restarts...
Initial Scheduling
When Nagios (re)starts, it will attempt to schedule the initial check of all objects in a manner that will minimize the load imposed on the local and remote hosts. This is done by spacing the initial checks out, as well as interleaving them. The spacing of checks (also known as the inter-check delay) is used to minimize/equalize the load on the local host running Nagios and the interleaving is used to minimize/equalize load imposed on remote hosts. Both the inter-check delay and interleave functions are discussed below.
Even though checks are initially scheduled to balance the load on both the local and remote hosts, things will eventually give in to the ensuing chaos and be a bit random. Reasons for this include the fact that objects are not all checked at the same interval, some objects take longer to execute than others, host and/or service problems can alter the timing of one or more checks, etc. At least we try to get things off to a good start. Hopefully the initial scheduling will keep the load on the local and remote hosts fairly balanced as time goes by...
Note: If you want to view the initial check scheduling information, start Nagios using the -s command line option. Doing so will display basic scheduling information (inter-check delay, interleave factor, first and last check time, etc) and will create a new status log that shows the exact time that all services are initially scheduled. Because this option will overwrite the status log, you should not use it when another copy of Nagios is running. Nagios does not start monitoring anything when this argument is used.
Inter-Check Delay
As mentioned before, Nagios attempts to equalize the load placed on the machine that is running Nagios by equally spacing out initial checks. The spacing between consecutive checks is called the inter-check delay. By giving a value to the host_inter_check_delay_method or service_inter_check_delay_method variables in the main config file, you can modify how this delay is calculated. This documentation will discuss how the "smart" calculation works, as this is the setting you will want to use for normal operation.
When using the "smart" setting of the host_inter_check_delay_method or service_inter_check_delay_method variables, Nagios will calculate an inter-check delay value by using the following calculations:
Host
- host inter-check delay = (average check interval for all hosts) / (total number of hosts)
- average check interval for all hosts = (total host check interval) / (total number of hosts)
- total host check interval = (total check_interval of all hosts) * (nagios.cfg check_interval)
Say you have 1,000 hosts that each have a check interval of 5 minutes. The total check_interval of all hosts is 5,000 (1,000 * 5) which means the total check interval for all hosts is 300,000 (5,000 * 60). That means the average check interval for all hosts is 300 seconds (300,000 / 1,000). Given that information, we realize that (on average) we need to re-check 1,000 hosts every 300 seconds. This means that we should use an inter-check delay of 0.3 seconds when spacing out the initial host checks. By spacing each host check out by 0.3 seconds, we can somewhat guarantee that Nagios is scheduling and/or executing 3 new host checks every second.
- 0.3 = 300 / 1,000
- 300 = 300,000 / 1,000
- 300,000 = 5,000 * 60
Service
- service inter-check delay = (average check interval for all services) / (total number of services)
- average check interval for all services = (total service check interval) / (total number of services)
- total service check interval = (total check_interval of all services) * (nagios.cfg check_interval)
Say you have 5,000 services that each have a check interval of 5 minutes. The total check_interval of all services is 25,000 (5,000 * 5) which means the total check interval for all services is 1,500,000 (25,000 * 60). That means the average check interval for all services is 300 seconds (1,500,000 / 5,000). Given that information, we realize that (on average) we need to re-check 5,000 services every 300 seconds. This means that we should use an inter-check delay of 0.06 seconds when spacing out the initial service checks. By spacing each service check out by 0.06 seconds, we can somewhat guarantee that Nagios is scheduling and/or executing 16 new service checks every second.
- 0.06 = 300 / 5,000
- 300 = 1,500,000 / 5,000
- 1,500,000 = 25,000 * 60
Summary
By spacing the checks out evenly over time like this, we can hope that the load on the local server that is running Nagios remains somewhat balanced. If you wanted your Nagios server to work harder then you would keep reducing the inter_check_delay to force more checks to be executed per second. If you wanted your Nagios server to work less then you would keep increasing the inter_check_delay to force less checks to be executed per second.
Service Interleaving
As discussed above, the inter-check delay helps to equalize the load that Nagios imposes on the local host. What about remote hosts? Is it necessary to equalize load on remote hosts? Why? Yes, it is important and yes, Nagios can help out with this. If you monitor a large number of services on a remote host and the checks were not spread out, the remote host might think that it was the victim of a SYN attack if there were a lot of open connections on the same port. Plus, attempting to equalize the load on hosts is just a nice thing to do...
By giving a value to the service_interleave_factor variable in the main config file, you can modify how the interleave factor is calculated. I will discuss how the "smart" calculation works, as this will probably be the setting you will want to use for normal operation. You can, however, use a pre-set interleave factor instead of having Nagios calculate one for you. Also of note, if you use an interleave factor of 1, service check interleaving is basically disabled.
When using the "smart" setting of the service_interleave_factor variable, Nagios will calculate an interleave factor by using the following calculation:
interleave factor = ceil ( total number of scheduled services / total number of hosts )
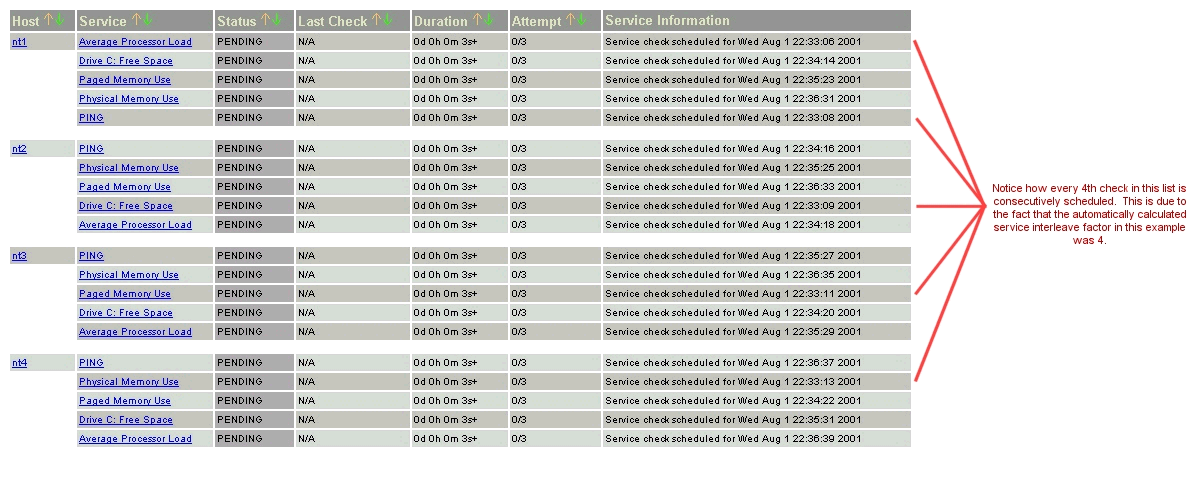
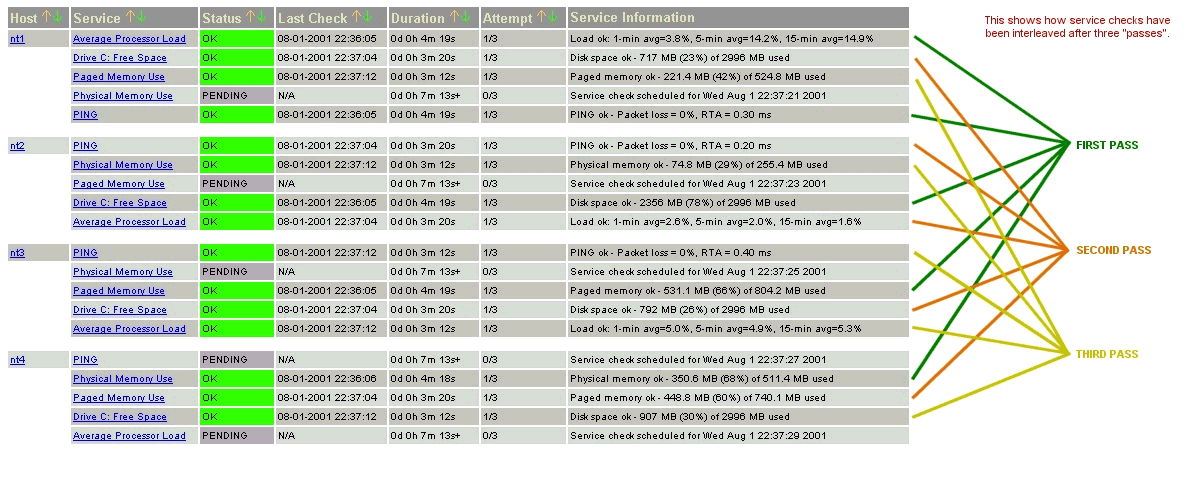
Total number of scheduled services means services that have active_checks_enabled=1. Here is an example. Say you have a total of 1,000 services and 150 hosts that you monitor. Nagios would calculate the interleave factor to be 7. This means that when Nagios schedules initial service checks it will schedule the first one it finds, skip the next 6, schedule the next one, and so on... This process will keep repeating until all service checks have been scheduled. Since services are sorted (and thus scheduled) by the name of the host they are associated with, this will help with minimizing/equalizing the load placed upon remote hosts.
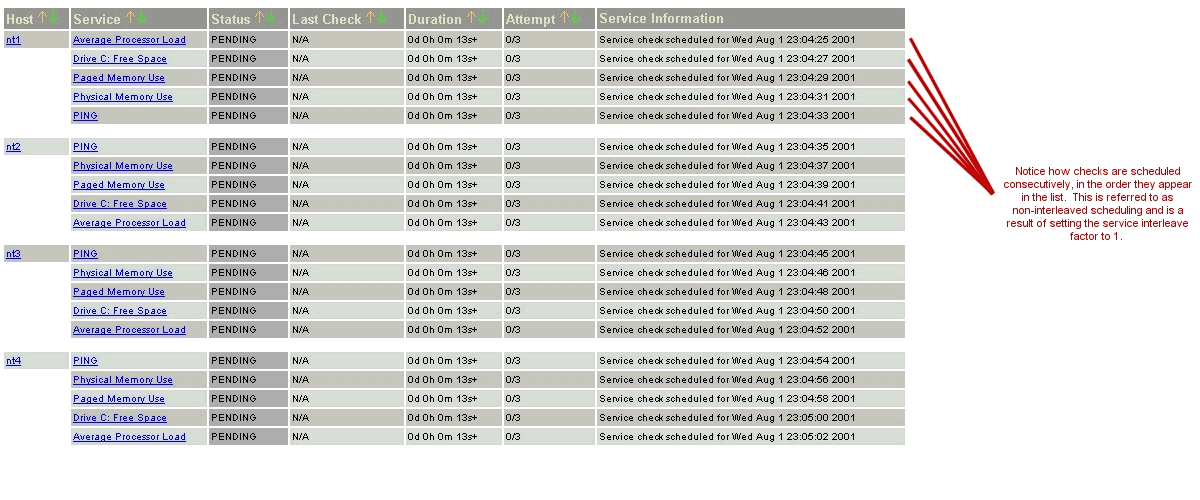
The images below depict how service checks are scheduled when they are not interleaved (service_interleave_factor=1) and when they are interleaved with the service_interleave_factor variable equal to 4.
Non-Interleaved Checks: | Interleaved Checks: |
 |
 |
 |
 |
 |
Maximum Concurrent Service Checks
In order to prevent Nagios from consuming all of your CPU resources, you can restrict the maximum number of concurrent service checks that can be running at any given time. This is controlled by using the max_concurrent_checks option in the main config file.
The good thing about this setting is that you can regulate Nagios' CPU usage. The down side is that service checks may fall behind if this value is set too low. When it comes time to execute a service check, Nagios will make sure that no more than x service checks are either being executed or waiting to have their results processed (where x is the number of checks you specified for the max_concurrent_checks option). If that limit has been reached, Nagios will postpone the execution of any pending checks until some of the previous checks have completed. So how does one determine a reasonable value for the max_concurrent_checks option?
First off, you need to know the following things...
- A general idea of the average time that service checks actually take to execute (most plugins timeout after 10 seconds, so the average is probably going to be lower)
- The inter-check delay that Nagios uses to initially schedule service checks (use the -s command line argument to check this)
Next, use the following calculation to determine a reasonable value for the maximum number of concurrent checks that are allowed...
maximum concurrent checks = ceil( average check execution time / inter-check delay )
The calculated number should provide a reasonable starting point for the max_concurrent_checks variable. You may have to increase this value a bit if service checks are still falling behind schedule or decrease it if Nagios is hogging too much CPU time.
Let's say you are monitoring 875 services, each with an average check interval of 2 minutes. Executing Nagios with the -s command line agument gives you the service inter-check delay of 0.14 seconds. From here you can then calculate:
72 = ceil( 10 / 0.14 )
In this case, the calculated value is going to be 72. Generally speaking you would probably increase the max_concurrent_checks value up to 80, since there will ramdon delays with the Nagios processes as it does other work. Obviously, you're going to have test and tweak things a bit to get everything running smoothly on your system, but hopefully this provided some general guidelines...
Time Restraints
The check_period option determines the time period during which Nagios can run checks. Regardless of what status a particular object is in, if the time that it is actually executed is not a valid time within the time period that has been specified, the check will not be executed. Instead, Nagios will reschedule the check for the next valid time in the time period. If the check can be run (e.g. the time is valid within the time period), the check is executed.
Note: Even though a check may not be able to be executed at a given time, Nagios may still schedule it to be run at that time. This is most likely to happen during the initial scheduling of hosts and services, although it may happen in other instances as well. This does not mean that Nagios will execute the check! When it comes time to actually execute a check, Nagios will verify that the check can be run at the current time. If it cannot, Nagios will not execute the check, but will instead just reschedule it for a later time. Don't let this one throw you confuse you! The scheduling and execution of checks are two distinctly different (although related) things.
Normal Scheduling
In an ideal world you wouldn't have network problems. But if that were the case, you wouldn't need a network monitoring tool. Anyway, when things are running smoothly, "normal" is defined as either one of the following:
- Host is UP
- Service is OK
Scheduling During Problems
So what happens when there are problems with a host or service? Well, one of the things that happens is the check scheduling changes. If you've configured the max_check_attempts option of the object definition to be something greater than 1, Nagios will recheck the object before deciding that a real problem exists. While the object is being rechecked (up to max_check_attempts times) it is considered to be in a "soft" state (as described here) and the checks are rescheduled at a frequency determined by the retry_interval option.
If Nagios rechecks the object max_check_attempts times and it is still in a non-UP or non-OK state, Nagios will put the object into a "hard" state, send out notifications to contacts (if applicable), and start rescheduling future checks of the object at a frequency determined by the check_interval option.
When a service check results in a non-OK state, Nagios will check the host that the service is associated with to determine whether or not is UP. If the host is not UP (i.e. it is either down or unreachable), Nagios will immediately put the service into a hard non-OK state and it will reset the current attempt number to 1. Since the service is in a hard non-OK state, the service check will be rescheduled at the normal frequency specified by the check_interval option instead of the retry_interval option.
Scheduling Delays
It should be noted that check scheduling and execution is done on a best effort basis. Individual checks are considered to be low priority events in Nagios, so they can get delayed if high priority events need to be executed. Examples of high priority events include log file rotations, external command checks, and reaper events. Additionally, host checks will slow down the execution and processing of service checks.
Scheduling Example
The scheduling of service checks, their execution, and the processing of their results can be a bit difficult to understand, so let's look at a simple example. Look at the diagram below - I'll refer to it as I explain how things are done.
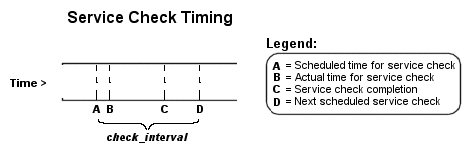 |
For the example here, a service has been scheduled to be executed at time A. However, Nagios got behind in its event queue, so the check was not actually executed until time B. The service check finished executing at time C, so the difference between points C and B is the actual amount of time that the check was running.
At the time that the service event receives the check result, it will reschedule the next service check and place it into Nagios' event queue. We'll assume that the service check resulted in an OK status, so the next check at time D is scheduled after the originally scheduled check time by a length of time specified by the check_interval option. Note that the service is not rescheduled based off the time that it was actually executed! There is one exception to this (isn't there always?) - if the time that the service check is actually executed (point B) occurs after the next service check time (point D), Nagios will compensate by adjusting the next check time. This is done to ensure that Nagios doesn't go nuts trying to keep up with service checks if it comes under heavy load.
Object Definition Options That Affect Scheduling
Each object definition contains a check_interval and retry_interval option. Hopefully this will clarify what these two options do, how they relate to the max_check_attempts option in the object definition, and how they affect the scheduling of the service.
First off, the check_interval option is the interval at which the object is checked under "normal" circumstances.
When an object first changes from an "normal" state to a "non-normal" state, Nagios gives you the ability to temporarily slow down or speed up the interval at which subsequent checks of that object will occur. When the object first changes state, Nagios will perform up to max_check_attempts-1 retries of the check before it decides its a real problem. While the object is being retried, it is scheduled according to the retry_interval option, which might be faster or slower than the normal check_interval option. While the object is being rechecked (up to max_check_attempts-1 times), the object is in a soft state. If the object is rechecked max_check_attempts-1 times and it is still in a "non-normal" state, the object turns into a hard state and is subsequently rescheduled at the normal rate specified by the check_interval option.
On a side note, it you specify a value of 1 for the max_check_attempts option, the object will not ever be checked at the interval specified by the retry_interval option. Instead, it immediately turns into a hard state and is subsequently rescheduled at the rate specified by the check_interval option.