Passive Host State Translation
Need Help Configuring Nagios?
Our tech support team is happy to help you with any questions you might have. Contact us on our online support forum at https://support.nagios.com/forum/
Nagios XI Makes Monitoring Easier:
Nagios XI is the easy-to-use, enterprise version of Nagios that features:
- Web-Based Configuration provides advanced configuration features
- Monitoring Wizards make it easy to monitor new devices, applications, and services
- Customizable Dashboards allow for per-user customization
- Integrated Performance Graphs provide trending and capacity planning information
- Advanced Reports provide data insight and exporting capabilities
- Data Visualizations enable powerful analysis of patterns and problems
- Nagios Core Import functionality makes it easy to migrate from Nagios Core
- ... and many other features
Download a free 30-day trial to give Nagios XI a spin.
Inquire today and let our Quickstart team help you get started with Nagios XI
 Up To: Contents
 See Also: Host Checks, Network Reachability, Passive Checks, Distributed Monitoring, Redundant/Failover Monitoring
Introduction
When Nagios Core receives passive host checks from remote sources (i.e other Nagios Core instances in distributed or failover setups), the host state reported by the remote source may not accurately reflect the state of the host from Nagios Core' view. As distributed and failover monitoring installations are fairly common, it is important to provide a mechanism for ensuring accurate host states between different instances of Nagios Core.
Different World Views
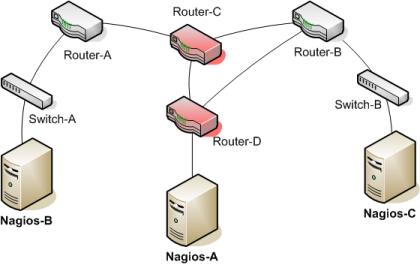
The image below shows a simplified view of a failover monitoring setup.
- Nagios-A is the primary monitoring server, and is actively monitoring all switches and routers.
- Nagios-B and Nagios-C are backup monitoring servers, and are receiving passive check results from Nagios-A
- Both Router-C and Router-D have suffered failures and are offline.

What states are Router-C and Router-D currently in? The answer depends on which Nagios instance you ask.
- Nagios-A sees Router-D as DOWN and Router-C as UNREACHABLE
- Nagios-B should see Router-C as DOWN and Router-D as UNREACHABLE
- Nagios-C should see both routers as being DOWN.
Each Nagios instance has a different view of the network. The backup monitoring servers should not blindly accept passive host states from the primary monitoring server, or they will have incorrect information on the current state of the network.
Without translating passive host check results from the primary monitoring server (Nagios-A), Nagios-C would see Router-D as UNREACHABLE, when it is really DOWN based on its viewpoint. Similarly, the DOWN/UNREACHABLE states (from the viewpoint of Nagios-A) for Router-C and Router-D should be flipped from the viewpoint of Nagios-B.
Note: There may be some situations where you do not want Nagios Core to translate DOWN/UNREACHABLE states from remote sources to their "correct" state from the viewpoint of the local Nagios Core instance. For example, in distributed monitoring environments you may want the central Nagios Core instance to know how distributed instances see their respective portions of the network.
Enabling State Translation
By default, Nagios will not automatically translate DOWN/UNREACHABLE states from passive check results. You will need to enable this feature if you need and want it.
The automatic translation of passive host check states is controlled by the translate_passive_host_checks variable. Enable it and Nagios will automatically translate DOWN and UNREACHABLE states from remote sources to their correct state for the local instance of Nagios.
