Copyright © 2010-2026
Nagios Enterprises, LLC. All rights reserved.
Nagios Fusion 
User Guide
The Home Page is the page that you land on when you login to Nagios Fusion. As stated in a previous section, this can either be set by the Nagios Administrator or (as long as the Administrator has enabled the feature) by a non-administrative user.
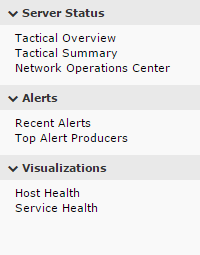 The Home Menu is an overview of the common data gathered and displayed by Nagios Fusion in regards to the servers your administrator has connected to. It was designed to give administrators and users quick access to the most important information in your Nagios Fusion setup.
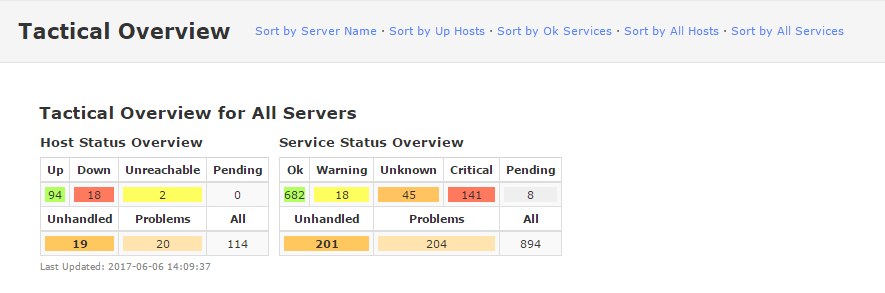 The Tactical Overview page breaks the overviews down by server - each giving you a table of data related to that server, as well as allowing you to see all of the cumulative data for 'All Servers'. Each of these tables has the ability to be added to a dashboard by hovering over them, and selecting the dashletize icon in the upper left hand corner that appears.
The Tactical Summary page displays very similar data to the Tactical Overview page, except that it is in the form of all servers are in one big table. This table is a dashlet, and has the ability to be added to a dashboard as well.
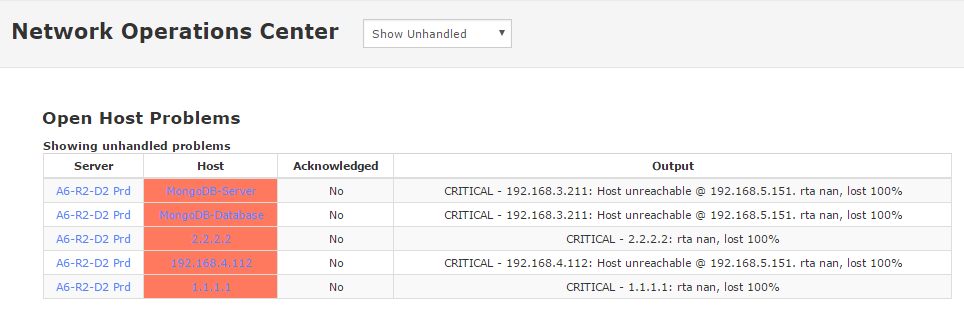 The Network Operations Center page displays Unhandled or Acknowledged (or both!) Host and Service Problems across all of your Fused Servers. This is where you'll go if you want to see how many items require attention right this moment.
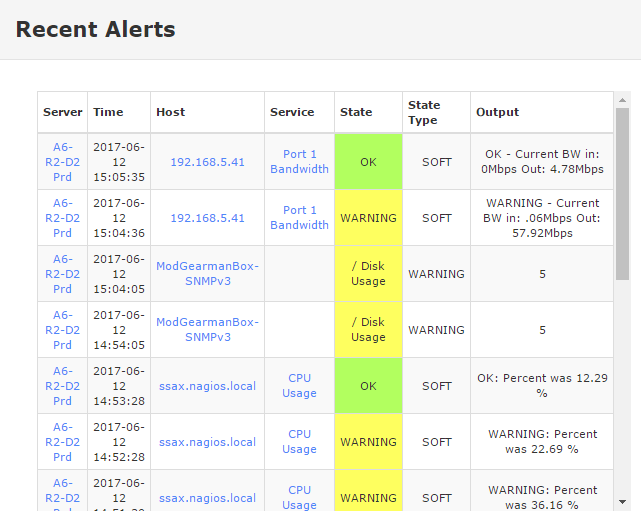 The Recent Alerts page displays the dashlet of the same name, containing alert information from all of your Fused Servers. It is aggregated, and the time is converted to your local time (that you have set in your Account Preferences) and then sorted based on which alert is the most recent. When adding this dashlet to a dashboard, you are able to specify the server to limit the alerts from.
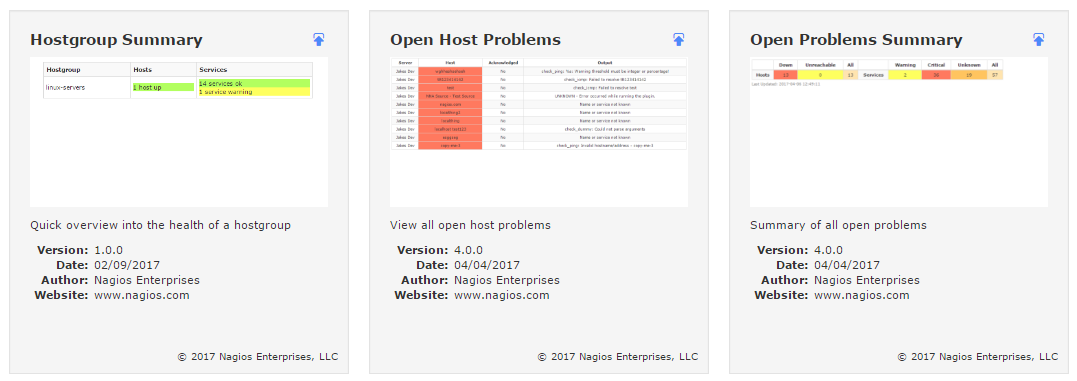
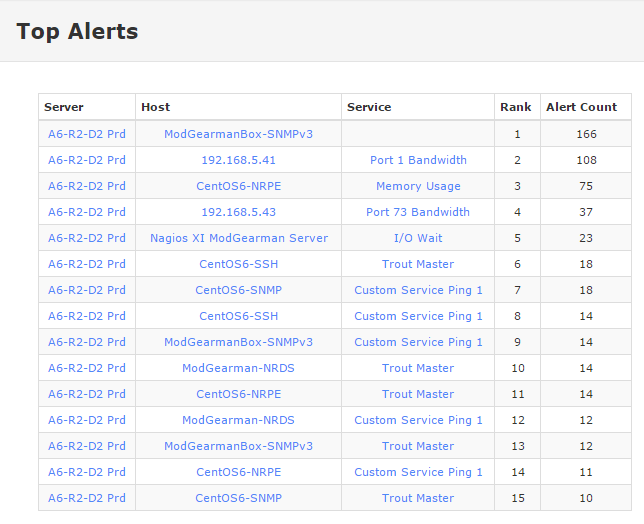 The Top Alert Producers page displays a dashlet containing the highest count of alerts from each server Fusion is connected to. They are ranked from highest alerting to lowest and displayed in tabular form.
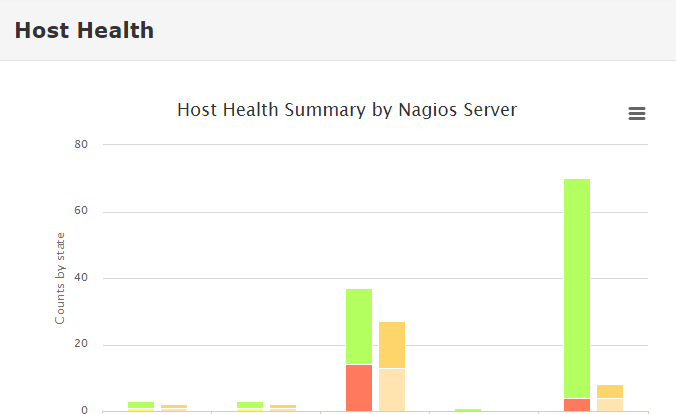 The Host Health page contains a dashlet of a graph displaying the overall health status of the Hosts on each of the Fused Servers. You are able to add this graph to a dashboard.
The Service Health page contains a dashlet of a graph displaying the overall health status of the Services on each of the Fused Servers. You are able to add this graph to a dashboard.
 Views are designed to provide individual users with quick access to Nagios Fusion pages and external websites they find useful. Views are often used by Network Administrators who wish to display important information on wall monitors in Network Operations Centers (NOCs) or public locations.
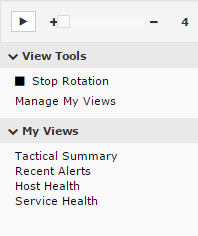
The Views page will automatically rotate through each of the views the user has defined. You can adjust the time of the rotation by grabbing and moving the slider. You can pause the view rotation by pressing the pause button, and then subsequently resume rotation by pressing the play button. You can stop rotation entirely by clicking the line Stop Rotation. You can restart the rotation by clicking Start Rotation.
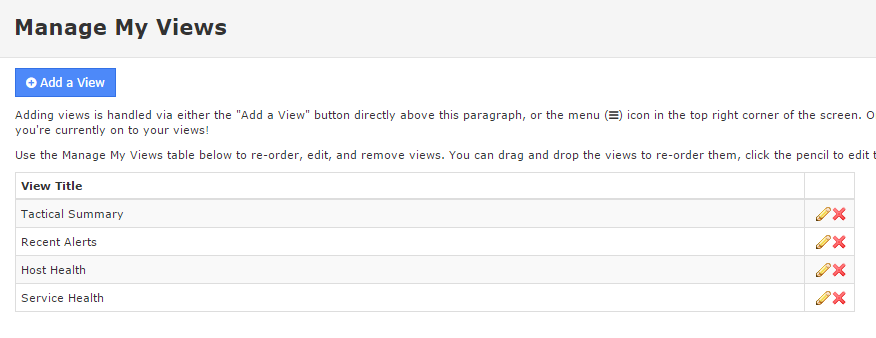 You can re-order the views by selecting Manage My Views and dragging and dropping them into their preferred order. Alternatively you can edit or remove them from that list as well.
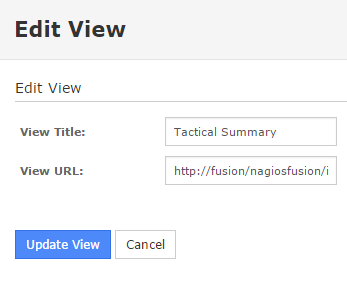
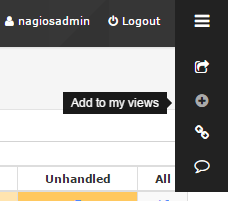 You can add a view by either selecting the Add a View button at the top of the Manage My Views page, or by navigating to the page you wish to add, and then hovering over the Menu icon () in the top right corner of the screen, waiting for the menu to appear, and then selecting the Add View icon (). Pressing that icon will bring up a popup allowing you to customize the view before it's added. Once you've added a view with this method, it will display in the views list and automatically be added to the rotation.
Finally! Let's talk about dashboards! What kind of product would Nagios Fusion be without the ability to customize your own preferred view of your overall network health? That's exactly what a dashboard is - a page that allows you to completely customize everything displayed on it. We add and remove what are called dashlets to our dashboards. Dashboards are simply empty pages when you create them, they are relatively useless until you start adding dashlets. When you add dashlets to your dashboards, you're transforming it into a powerful feature designed to provide you with the information you find useful.
 When your account is created, you start with two dashboards: Home Dashboard, and your Screen Dashboard. The Home Dashboard is the one that is displayed when you first click on the Dashboard menu link (and sometimes it is what you see when you first login to Nagios Fusion, depending on the Home Page Modification Settings set either by you, or your Fusion Administrator). The Screen Dashboard is essentially a dashboard that lives on top of the entire Nagios Fusion interface. When you add dashlets to your Screen Dashboard, they appear on top of anything else no matter what page you're on in Fusion.
You may find, as a non-administrative user, that you have some Dashboards that you can't modify or delete, and that no matter how much you move or remove the dashlets on that dashboard that they always reappear when you visit it again. These are synchronized dashboards, dashboards that have been deployed to you by an Administrator and are essentially locked. Administrators also have the ability to synchronize Home and Screen Dashboards, which locks those from being editted as well. You can find out more about deploying dashboards in the Administrator's guide.
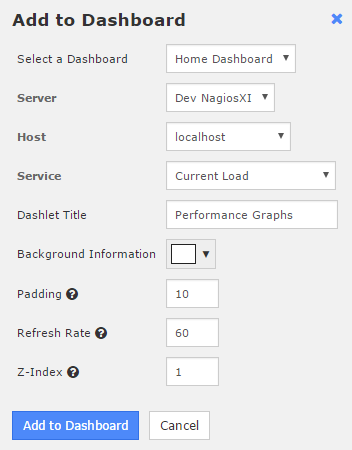 Almost everything that displays meaningful data in Nagios Fusion is a dashlet. When you come across a dashlet on a page, you can mouse over it and see the Dashletize icon () popup. If you click that icon, you're prompted with some information about the dashlet - which dashboard to add it to, some styling data (title, padding, background color, refresh rate, etc.), and the data necessary to display the data. For example, when adding a Performance Graph dashlet, you'll need to specify the Fused Server, the Host from that Server, and the Service that belongs to that Host in order to display the specific data you want.
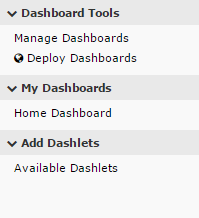
You can also add a dashlet by navigating to the Available Dashlets page, which presents you with a list of all of the dashlets that are available on your Nagios Fusion server. Adding one is simple: find the one you want, click the dashletize icon, and then fill out the information specified in the previous paragraph.
As long as the dashlet isn't pinned, you're able to grab the edges and resize. You can move the dashlet around on the dashboard simply by clicking in the dashlet, holding your mouse down, and then dragging it to your preferred location.
![]() One of the newly introduced options in Nagios Fusion 4 is the ability to update this data on the fly! When you mouse over the dashlet you'll notice a few icons appear. There is another dashletize icon () available (on the left), which allows you to quickly add this same dashlet to other dashboards easily. On the right hand side, you'll see the following icons:
One of the newly introduced options in Nagios Fusion 4 is the ability to update this data on the fly! When you mouse over the dashlet you'll notice a few icons appear. There is another dashletize icon () available (on the left), which allows you to quickly add this same dashlet to other dashboards easily. On the right hand side, you'll see the following icons:
In addition to the icons, you're also able to click directly on the title, which will bring up a textbox allowing you to change the title of the dashlet immediately - without the need to open the dashlet settings window.
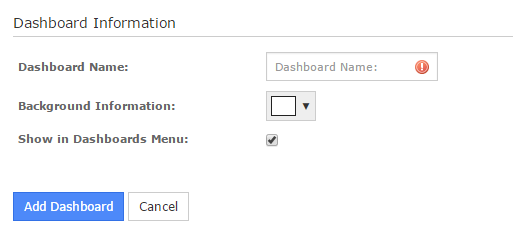 When you click on the Dashboard menu link, you're brought to your Home Dashboard. The navigation menu on the left hand side is populated with a link to each of your existing dashboards along with Manage Dashboards. Click on Manage Dashboards, and you're brought to the page where you can add, edit, and remove dashboards. As stated previously, if a dashboard was synchronized/deployed to you from an Administrator, then you'll be unable to edit or remove that dashboard. Otherwise, you're able to add dashboards by clicking on Add a Dashboard and filling out the information (Dashboard Name, Background Information, Show in Dashboards Menu).
The Help menu provides you with direct access to Nagios Fusion support resources. Use this to find your way to the support forum, the library, the knowledge base, etc.
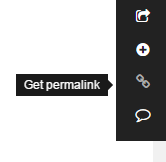 All of the pages within Nagios Fusion are accessed by a URL. The URL for any of the pages in Nagios Fusion can be accessed by clicking the Permalink icon (), which you gain access to by hovering over the Menu icon () in the upper right hand corner of the Fusion interface.
Nagios Fusion also has a built in feedback feature which allows you to send your feedback directly to the Nagios development team. To access the feedback form, click on the Send us Feedback icon () located in the Menu icon () drop-down we just mentioned.