Graphing Performance Info With MRTG
Need Help Configuring Nagios?
Our tech support team is happy to help you with any questions you might have. Contact us on our online support forum at https://support.nagios.com/forum/
Nagios XI Makes Monitoring Easier:
Nagios XI is the easy-to-use, enterprise version of Nagios that features:
- Web-Based Configuration provides advanced configuration features
- Monitoring Wizards make it easy to monitor new devices, applications, and services
- Customizable Dashboards allow for per-user customization
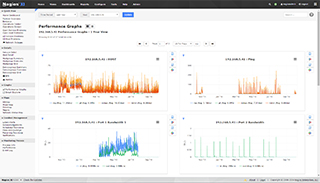
- Integrated Performance Graphs provide trending and capacity planning information
- Advanced Reports provide data insight and exporting capabilities
- Data Visualizations enable powerful analysis of patterns and problems
- Nagios Core Import functionality makes it easy to migrate from Nagios Core
- ... and many other features
Download a free 30-day trial to give Nagios XI a spin.
Inquire today and let our Quickstart team help you get started with Nagios XI
 Up To: Contents
 See Also: Nagiostats Utility, Performance Tuning
Introduction
The nagiostats utility allows you to graph various Nagios performance statistics over time using MRTG. This is important because it can help you:
- Ensure Nagios is operating efficiently
- Locate problem areas in the monitoring process
- Observe the performance impacts of changes in your Nagios configuration
Sample MRTG Configuration
Sample MRTG configuration file snippets for graphing various Nagios performance statistics can be found in the mrtg.cfg file located in the sample-config/ subdirectory of the Nagios distribution. You can create graphs of other performance information if you'd like - the samples just provide you with a good starting point.
Once you copy these sample entries into your MRTG config file (/etc/mrtg/mrtg.cfg) you should have some new graphs the next time MRTG runs.
Example Graphs
I'll describe what a few of the sample MRTG graphs mean and what they can be used for.
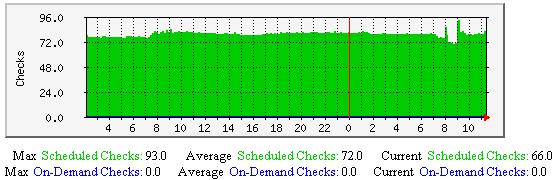
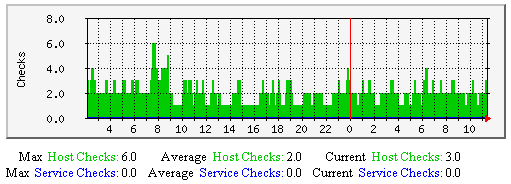
Active Host Checks - This graph shows how may active host checks (regularly scheduled and on-demand) have occurred over time. Useful for understanding:
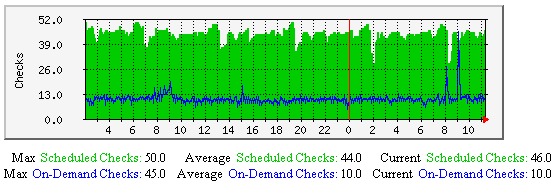
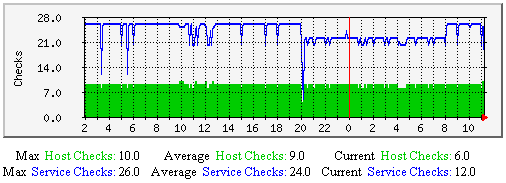
Active Service Checks - This graph shows how may active service checks (reguarly scheduled and on-demand) have occurred over time. Useful for understanding:
Cached Host and Service Checks - This graph shows how may cached host and service checks have occurred over time. Useful for understanding:
Passive Host and Service Checks - This graph shows how may passive host and service checks have occurred over time. Useful for understanding:
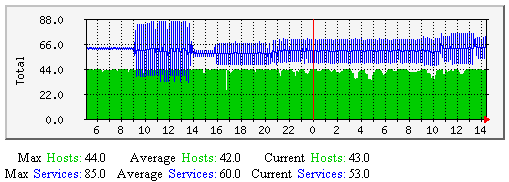
Hosts/Services Actively Checked - This graph shows how many (of the total number of) hosts and services were last checked actively over time. Useful for understanding:
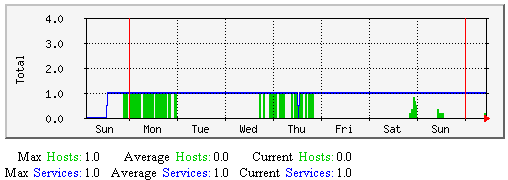
Hosts/Services Passively Checked - This graph shows how many (of the total number of) hosts and services were last checked passively over time. Useful for understanding:
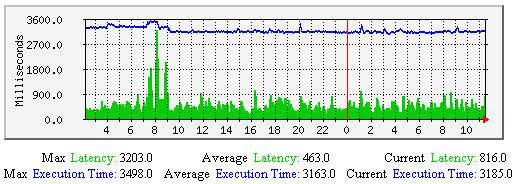
Average Service Check Latency and Execution Time - This graph shows average service check latency and execution times over time. Useful for understanding:
Consistently high latencies can be an indication that one of more of the following variables need tweaking:
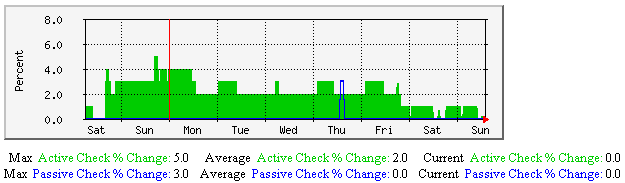
Average Service State Change - This graph shows the average percent state change (a measure of volatility) for services over time, broken down by services that were last checked either actively or passively. Useful for understanding:
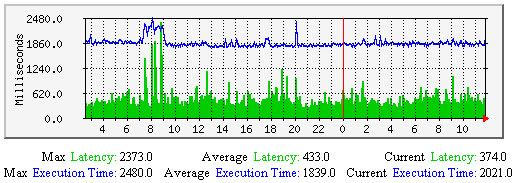
Average Host Check Latency and Execution Time - This graph shows average host check latency and execution times over time. Useful for understanding:
Consistently high latencies can be an indication that one of more of the following variables need tweaking:
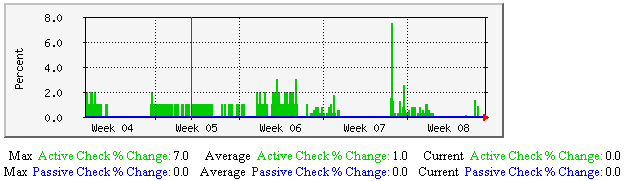
Average Host State Change - This graph shows the average percent state change (a measure of volatility) for hosts over time, broken down by hosts that were last checked either actively or passively. Useful for understanding:
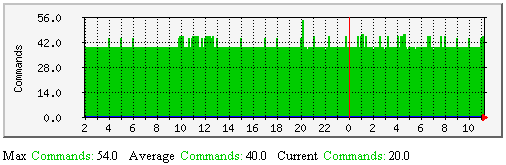
External Commands - This graph shows how may external commands have been processed by the Nagios Core daemon over time. Unless you're processing a large number of external commands (as in the case with distributed monitoring setups), this graph may appear mostly empty. Monitoring external commands can be useful for understanding the impacts of:
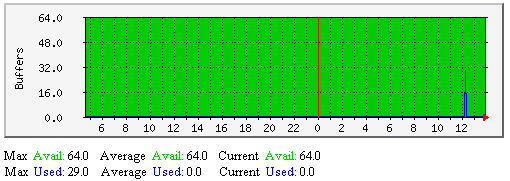
External Command Buffers (Deprecated) - This graph shows how may external command buffer slots are in use over time. If the number of used buffers is near the number of available buffers on a regular basis, it is likely you need to increase the available external command buffer slots. Each buffer slot can hold one external command. Buffers are used for temporarily holding external commands from the time they are read from the external command file to the time they are processed by the Nagios Core daemon.