
Tuning Nagios For Maximum Performance
Need Help Configuring Nagios?
Our tech support team is happy to help you with any questions you might have. Contact us on our online support forum at https://support.nagios.com/forum/
Nagios XI Makes Monitoring Easier:
Nagios XI is the easy-to-use, enterprise version of Nagios that features:
- Web-Based Configuration provides advanced configuration features
- Monitoring Wizards make it easy to monitor new devices, applications, and services
- Customizable Dashboards allow for per-user customization
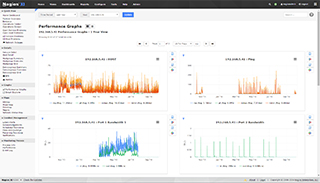
- Integrated Performance Graphs provide trending and capacity planning information
- Advanced Reports provide data insight and exporting capabilities
- Data Visualizations enable powerful analysis of patterns and problems
- Nagios Core Import functionality makes it easy to migrate from Nagios Core
- ... and many other features
Download a free 30-day trial to give Nagios XI a spin.
Inquire today and let our Quickstart team help you get started with Nagios XI
 Up To: Contents
 See Also: Large Installation Tweaks, Distributed Monitoring, Fast Startup Options, Graphing Performance Info
Introduction
So you've finally got Nagios Core up and running and you want to know how you can tweak it a bit. Tuning Nagios Core to increase performance can be necessary when you start monitoring a large number (> 1,000) of hosts and services. Here are a few things to look at for optimizing Nagios Core.
Optimization Tips
-
Graph performance statistics with MRTG
In order to keep track of how well your Nagios Core installation handles load over time and how your configuration changes affect it, you should be graphing several important statistics with MRTG. This is really, really, really useful when it comes to tuning the performance of a Nagios Core installation. Information on how to do this can be found here. -
Use large installation tweaks
Enabling the use_large_installation_tweaks option may provide you with better performance. Read more about what this option does here. -
Disable environment macros
Macros are normally made available to check, notification, event handler, etc. commands as environment variables. This can be a problem in a large Nagios Core installation, as it consumes some additional memory and (more importantly) more CPU. If your scripts don't need to access the macros as environment variables (e.g. you pass all necessary macros on the command line), you don't need this feature. You can prevent macros from being made available as environment variables by using the enable_environment_macros option. -
Check Result Reaper Frequency
The check_result_reaper_frequency variable determines how often Nagios Core should check for host and service check results that need to be processed. The maximum amount of time it can spend processing those results is determined by the max reaper time (see below). If your reaper frequency is too high (too infrequent), you might see high latencies for host and service checks. Beginning with Nagios Core 4, active check results are fed back to the main Nagios Core process by the core workers as soon as they are received. As a result, this variable has no effect on active check results. It still applies to passivecheck results. -
Max Reaper Time
The max_check_result_reaper_time variables determines the maximum amount of time the Nagios Core daemon can spend processing the results of host and service checks before moving on to other things - like executing new host and service checks. A value that is too high can result in large latencies for your host and service checks. A value that is too low can have the same effect. If you're experiencing high latencies, adjust this variable and see hat effect it has. Again, you should be graphing statistics in order to make this determination. Beginning with Nagios Core 4, active check results are fed back to the main Nagios Core process by the core workers as soon as they are received. As a result, this variable has no effect on active check results. It still applies to passive check results. -
Check service latencies to determine best value for maximum concurrent checks
Nagios Core can restrict the number of maximum concurrently executing service checks to the value you specify with the max_concurrent_checks option. This is good because it gives you some control over how much load Nagios Core will impose on your monitoring host, but it can also slow things down. If you are seeing high latency values (> 10 or 15 seconds) for the majority of your service checks (via the extinfo CGI), you are probably starving Nagios Core of the checks it needs. That's not Nagios Core's fault - its yours. Under ideal conditions, all service checks would have a latency of 0, meaning they were executed at the exact time that they were scheduled to be executed. However, it is normal for some checks to have small latency values. I would recommend taking the minimum number of maximum concurrent checks reported when running Nagios Core with the -s command line argument and doubling it. Keep increasing it until the average check latency for your services is fairly low. More information on service check scheduling can be found here. -
Use passive checks when possible
The overhead needed to process the results of passive service checks is much lower than that of "normal" active checks, so make use of that piece of info if you're monitoring a slew of services. It should be noted that passive service checks are only really useful if you have some external application doing some type of monitoring or reporting, so if you're having Nagios Core do all the work, this won't help things. -
Avoid using interpreted plugins
One thing that will significantly reduce the load on your monitoring host is the use of compiled (C/C++, etc.) plugins rather than interpreted script (Perl, etc) plugins. While Perl scripts and such are easy to write and work well, the fact that they are compiled/interpreted at every execution instance can significantly increase the load on your monitoring host if you have a lot of service checks. If you want to use Perl plugins, consider compiling them into true executables using perlcc(1) (a utility which is part of the standard Perl distribution). -
Optimize host check commands
If you're checking host states using the check_ping plugin you'll find that host checks will be performed much faster if you break up the checks. Instead of specifying a max_attempts value of 1 in the host definition and having the check_ping plugin send 10 ICMP packets to the host, it would be much faster to set the max_attempts value to 10 and only send out 1 ICMP packet each time. This is due to the fact that Nagios Core can often determine the status of a host after executing the plugin once, so you want to make the first check as fast as possible. This method does have its pitfalls in some situations (i.e. hosts that are slow to respond may be assumed to be down), but you'll see faster host checks if you use it. Another option would be to use a faster plugin (i.e. check_fping) as the host_check_command instead of check_ping. -
Schedule regular host checks
Scheduling regular checks of hosts can actually help performance in Nagios Core. This is due to the way the cached check logic works (see below). Prior to Nagios Core 3, regularly scheduled host checks used to result in a big performance hit. This is no longer the case, as host checks are run in parallel - just like service checks. To schedule regular checks of a host, set the check_interval directive in the host definition to something greater than 0. -
Enable cached host checks
Beginning in Nagios Core 3, on-demand host checks can benefit from caching. On-demand host checks are performed whenever Nagios Core detects a service state change. These on-demand checks are executed because Nagios Core wants to know if the host associated with the service changed state. By enabling cached host checks, you can optimize performance. In some cases, Nagios Core may be able to used the old/cached state of the host, rather than actually executing a host check command. This can speed things up and reduce load on monitoring server. In order for cached checks to be effective, you need to schedule regular checks of your hosts (see above). More information on cached checks can be found here. -
Don't use agressive host checking
Unless you're having problems with Nagios Core recognizing host recoveries, I would recommend not enabling the use_aggressive_host_checking option. With this option turned off host checks will execute much faster, resulting in speedier processing of service check results. However, host recoveries can be missed under certain circumstances when this it turned off. For example, if a host recovers and all of the services associated with that host stay in non-OK states (and don't "wobble" between different non-OK states), Nagios Core may miss the fact that the host has recovered. A few people may need to enable this option, but the majority don't and I would recommend not using it unless you find it necessary. -
Optimize hardware for maximum performance
NOTE: Hardware performance shouldn't be an issue unless: 1) you're monitoring thousands of services, 2) you're doing a lot of post-processing of performance data, etc. Your system configuration and your hardware setup are going to directly affect how your operating system performs, so they'll affect how Nagios Core performs. The most common hardware optimization you can make is with your hard drives. CPU and memory speed are obviously factors that affect performance, but disk access is going to be your biggest bottleneck. Don't store plugins, the status log, etc on slow drives (i.e. old IDE drives or NFS mounts). If you've got them, use SSDs. You can also use a RAMdisk for objects.cache and status.dat to increase load speed. An important note for IDE/Linux users is that many Linux installations do not attempt to optimize disk access. If you don't change the disk access parameters (by using a utility like hdparam), you'll loose out on a lot of the speedy features of the new IDE drives.