Copyright © 2010-2026
Nagios Enterprises, LLC. All rights reserved.
Getting Started
Installation
- System Requirements
- Ports and Protocols
- Installation Options
- Using the Virtual Machine
- Installing Nagios XI with VMware Workstation
- Installing Nagios XI with VMware ESX vSphere
- Converting The VMware Image To VirtualBox
- Installing Nagios XI with Hyper-V
- Manual Installation
- Installing Nagios XI via RPM
- Installing Nagios XI In An Offline Environment
Updates
System Configuration
- Best Practices
- Initial Setup
- License Settings & Activation
- General Program Options
- Changing The XI System Time
- Customizing the XI Landing Page
- Email Settings
- Understanding Email Sending
- Configuring Email Notifications
- Inbound Email Commands
- Notification Escalations
- Scheduling Downtime
- Audio Alerting
- SMS Alerting
- Twilio SMS Integration
- Setting Up Microsoft SMTP with OAuth 2.0
- Setting up Gmail SMTP With OAuth 2.0
- Discord Integration
- MultiTech MTR API Integration
- Slack Integration
- Using DUO 2FA
Agents
Monitoring Configuration
- Using Monitoring Wizards
- Using Auto-Discovery
- Bulk Host Import Wizard
- Bulk Renaming Tool
- Business Process Intelligence (BPI)
- Core Configuration Manager (CCM)
- Maintaining Manual Object Configuration Files
- Notification Variables
- Changing Host Alive Check
- Load Balanced Cloud Host Checks
- Using the Deadpool
- Using the Generic Plugin Wizard
- Using the Negate Plugin
- Using NRDP With Nagios XI
- Using the XI Helper
- Understanding User Macros
- Understanding The User Macros Component
- Using The SNMP Walk Wizard
- Excluding Hosts And Hostgroups
- Log Monitoring with Swatch
- Monitoring Hosts Using SSH
- Monitoring Hosts Using NRPE
- Monitoring Linux Using NCPA
- Monitoring Linux Using NRPE (Legacy)
- Monitoring Linux Using SNMP
- Monitoring Active Directory with LDAP
- Monitoring AIX
- Monitoring Amazon EC2
- Monitoring Amazon S3
- Monitoring Apache ActiveMQ
- Monitoring Apache Tomcat
- Monitoring a Cassandra Database
- Monitoring a DHCP Server
- Monitoring DigitalOcean
- Monitoring DNS Queries
- Monitoring Docker Containers
- Monitoring Domain Expiration
- Monitoring Email Delivery
- Monitoring FTP Servers
- Monitoring a Generic Device (Ping)
- Monitoring GlassFish
- Monitoring JBoss/WildFly
- Monitoring JMX
- Monitoring JSON APIs
- Monitoring Kubernetes
- Monitoring LDAP Servers
- Monitoring Linode
- Monitoring Nagios Log Server Queries
- Monitoring Mail Servers
- Monitoring Meraki Switches
- Monitoring MongoDB Servers & DBs
- Monitoring MySQL Servers & Queries
- Monitoring Nagiostats
- Monitoring A Nagios XI Server
- Monitoring Nutanix CE
- Monitoring OpenAI Usage
- Monitoring OpenShift
- Monitoring Oracle Databases
- Monitoring OSX
- Monitoring PostgreSQL
- Monitoring JetDirect Printers
- Monitoring Proxmox VE
- Monitoring Prometheus
- Monitoring Rackspace
- Monitoring RADIUS Servers
- Monitoring SLAs
- Monitoring SNMP OIDs
- Monitoring SNMP Traps
- Monitoring Solaris with NCPA
- Monitoring Switches and Routers
- Monitoring TCP/UDP Ports
- Monitoring TFTP Servers
- Monitoring VMware
- Monitoring WatchGuard
- Monitoring WebLogic
- Monitoring Websensor EM08
- Monitoring Websites
- Monitoring Website Defacement
- Monitoring XCP-ng/Vates VMS
- Monitoring XML APIs
- Monitoring Zabbix Agents
- Passive Monitoring
Monitoring Windows
- Using NCPA
- Using NSClient++
- Using SNMP
- Using WinRM
- Monitoring MS 365
- Monitoring Windows Event Logs
- Monitoring Microsoft Exchange
- Monitoring Hyper-V
- Adding Windows Disk Usage Checks
- Monitoring Microsoft SQL MSSQL
- Checking For Windows Updates
- Passive Monitoring with NRDS_Win
User Management
Visualizations
- XI Details Overview
- XI Dashboards
- XI Views
- XI Tools
- Generating Graphs
- Generating Reports
- Generating SLA Reports
- Using Capacity Planning
- Scheduling Reports & Pages
- Using the World Map
- Using NagVis
System Management
- Directory Structure
- Log Locations and Descriptions
- Backing Up And Restoring
- Configuration Snapshots
- Boosting Performance
- Repairing Database
- Database Optimization
- Managing Remote Nagios XI Servers
Advanced Topics
- Nagios XI Architecture
- High Availability
- Migrating From Nagios Core to XI
- Configuring Core Contacts To Use XI's phpmailer SMTP Settings
- SNMP Trap Integration
- Distributed Monitoring
- Enabling NagVis Restart Actions
- Integrating Nagios Mod-Gearman
- Exporting the XI Configuration Database
- Using Auto Deployment (NCPA)
- Automated Host Management
- SSO with Microsoft Azure Active Directory
- Authenticating with Active Directory
- Configuring SSL with Nagios XI
- Using SSL with XI Active Directory
- Using a Proxy
- Integrating MNTOS With Nagios
- Integrating Apache Mod_Security With XI
- Introduction to Event Handlers
- Restarting a Linux/Windows Services with XI
- Redundancy And Security Planning
- Using the Experimental InfluxDB Module
Developer Tools
- Global Event Handlers
- Accessing and Using the REST API
- Configuring FTP on XI Servers
- Writing Custom Wizards
- Component Development
- Integrating autoIT with Nagios
- Actions Component
- Contributing To Nagios Translations
Extending Nagios XI
Monitoring Configuration
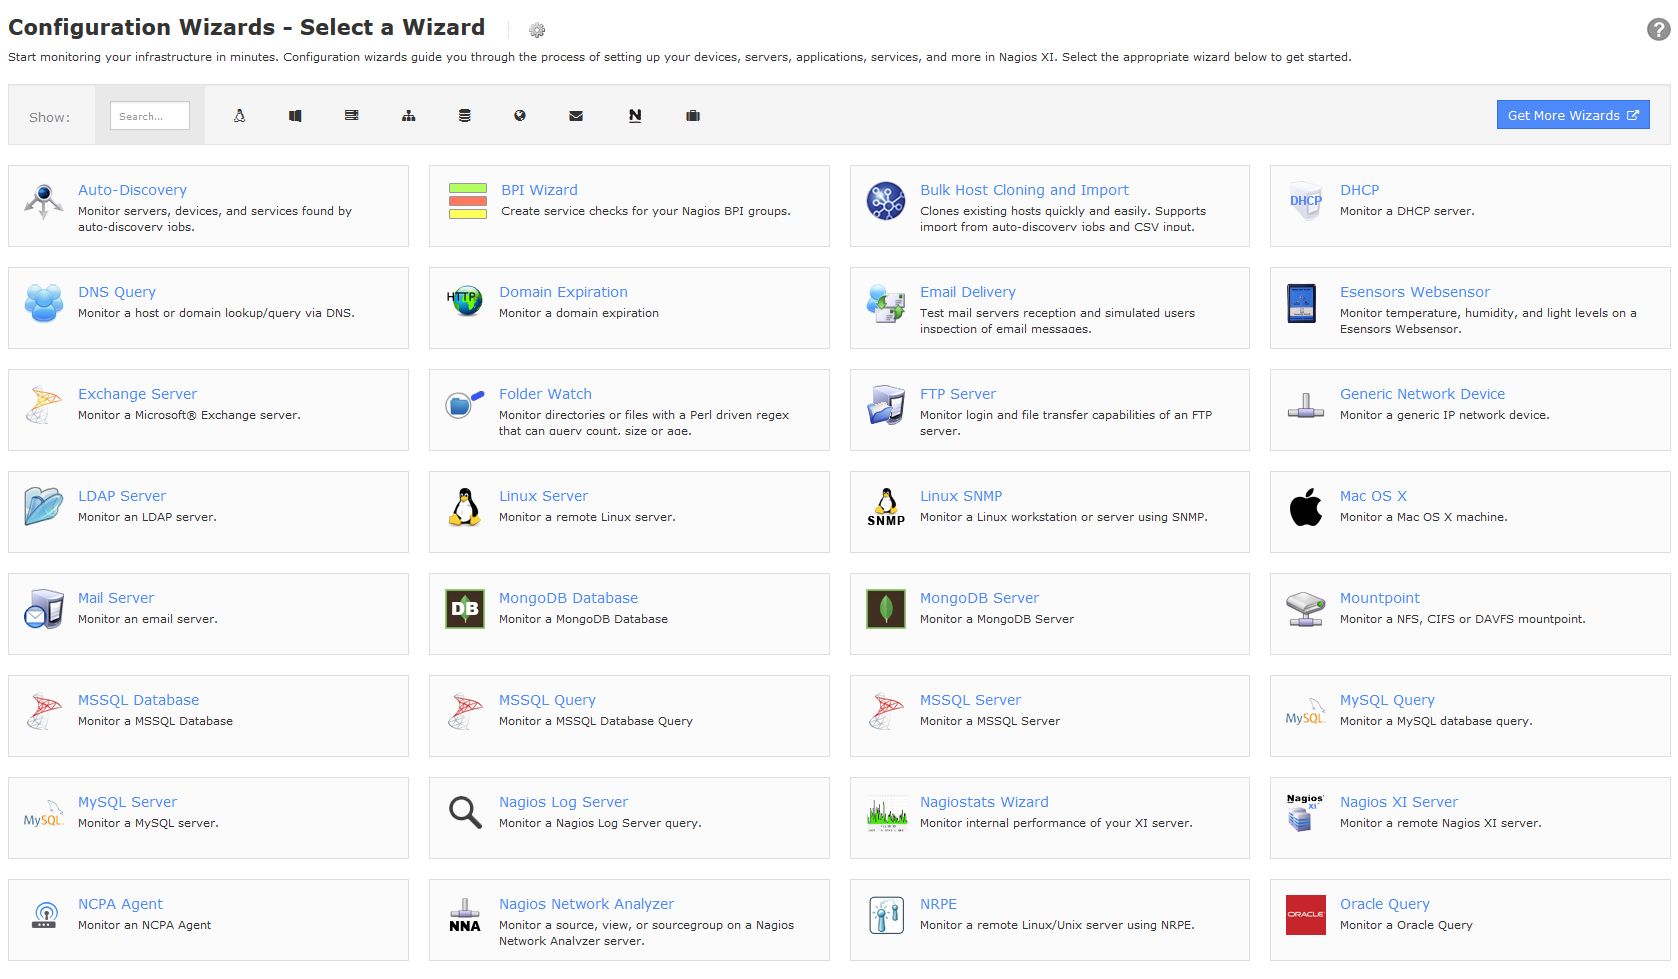
Monitoring Wizards
Monitoring wizards provide users with a simple step-by-step method of monitoring new devices, services, and applications. To access the monitoring wizard, select the Configure menu (at the top of the UI if you are using the Modern theme, or the gear icon in the lefthand menu if you are using Neptune), and click the Configuration Wizards link.
Running A Wizard
The following example takes you through the Website monitoring wizard to demonstrate how wizards work.
To get started with monitoring a new device, service, or application, select the appropriate wizard from the available list.
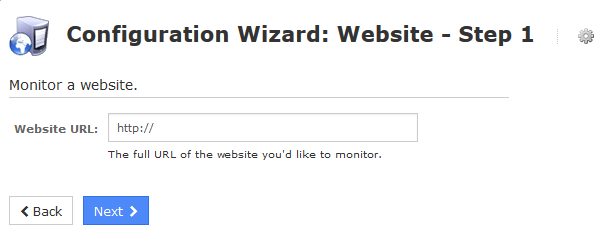
After selecting the appropriate wizard, Nagios XI will ask for the relevant host information. This information will vary depending the type of monitor you're setting up. For this example, the website wizard asks for the URL of the site to be monitored.
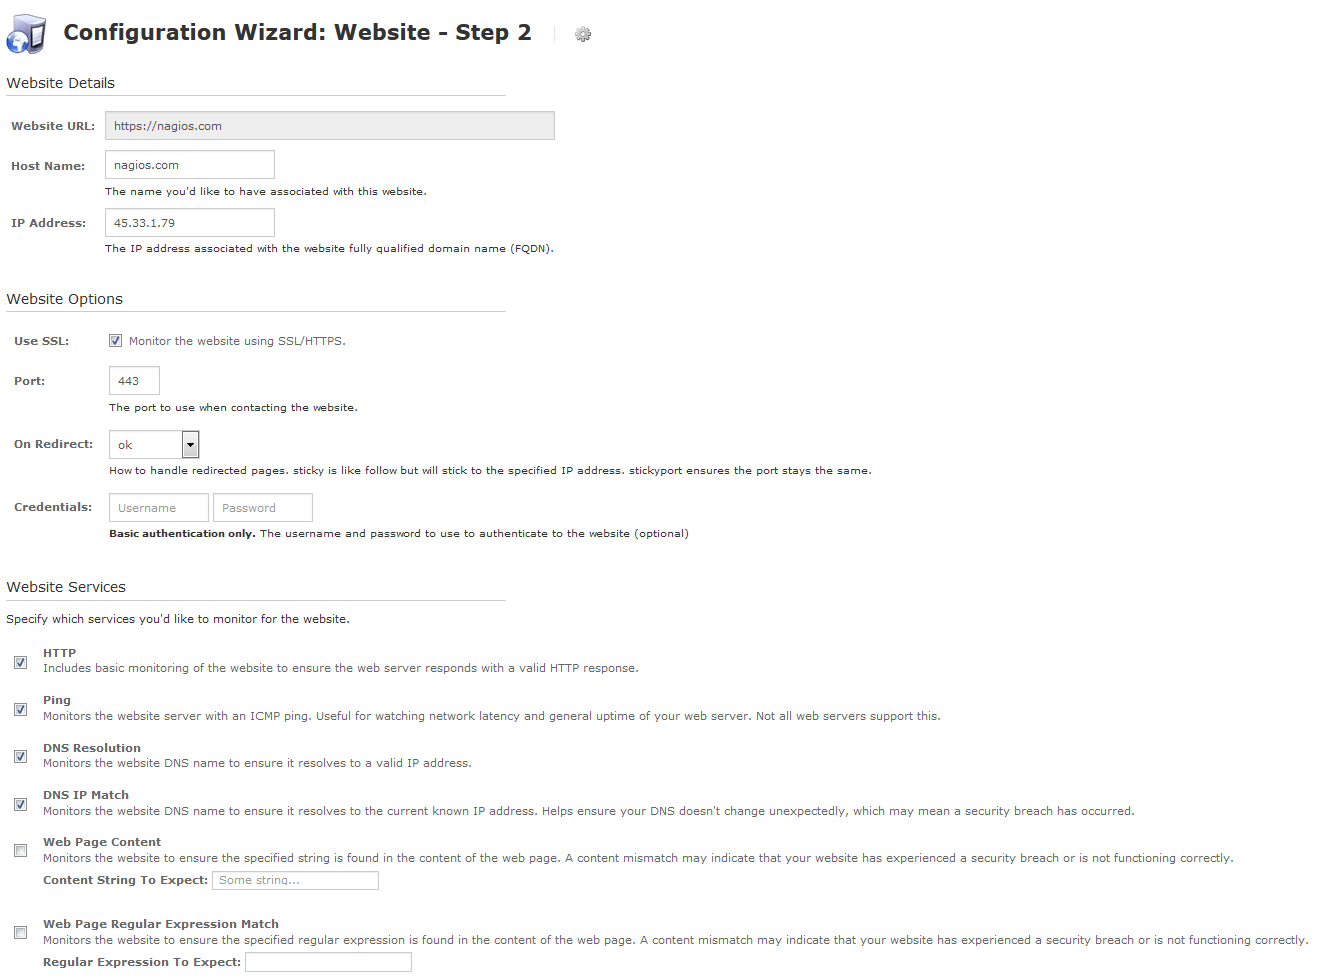
After providing the requested host information, the monitoring wizard will ask for the information relevant to the services you can monitor for the selected host.
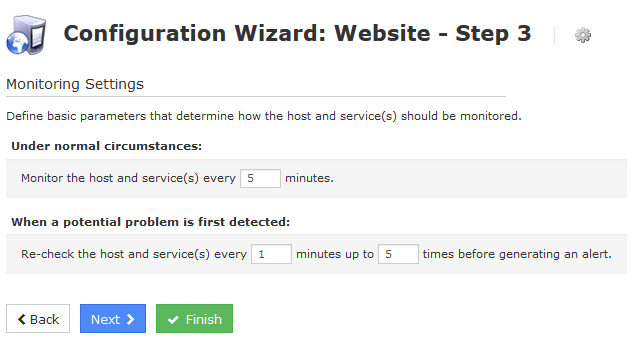
The wizard will then ask for the time increments for monitoring the host and services.
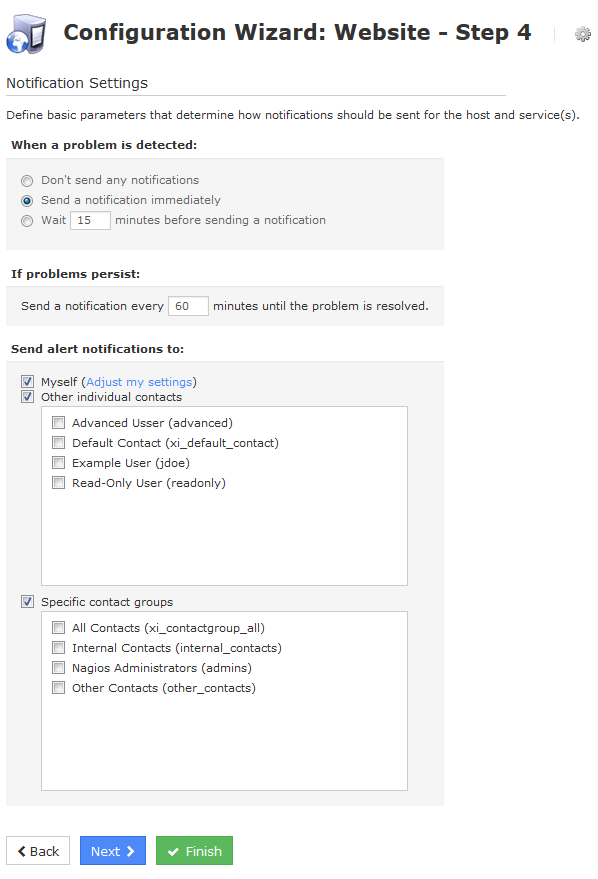
The wizard will then allow you to specify the circumstances and contacts for notifications relating to the host and services.
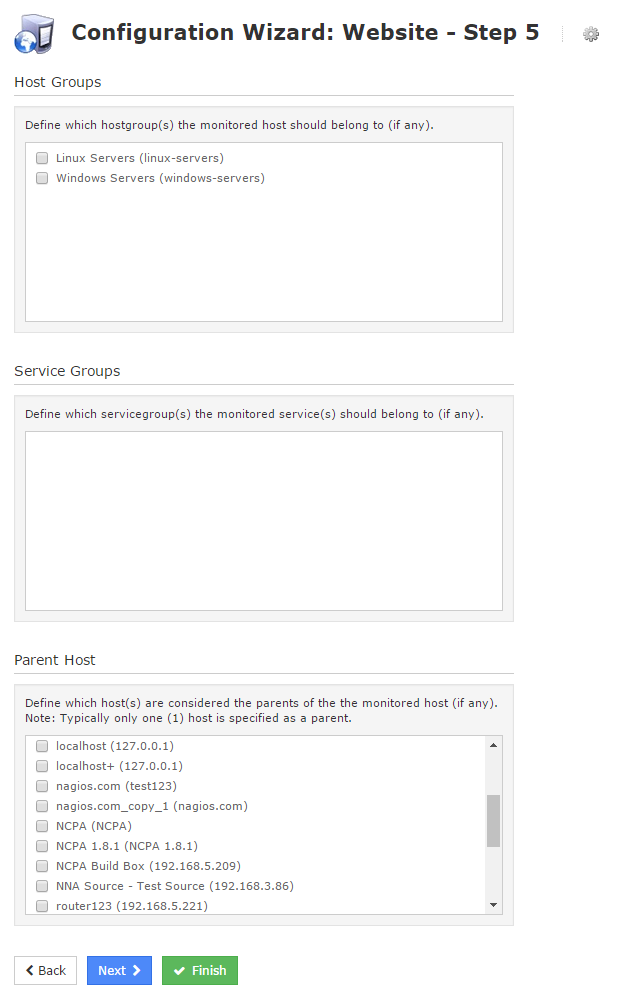
The wizard will then allow you to set hostgroup and servicegroup associations, and to definte a parent host
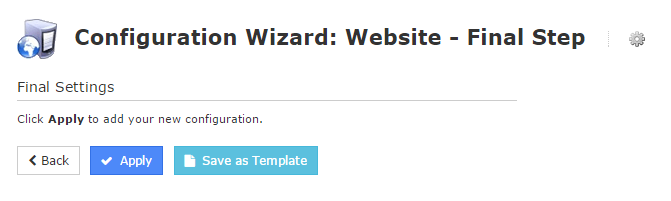
Click the Apply button to submit the items you selected to monitor to the underlying monitoring engine.
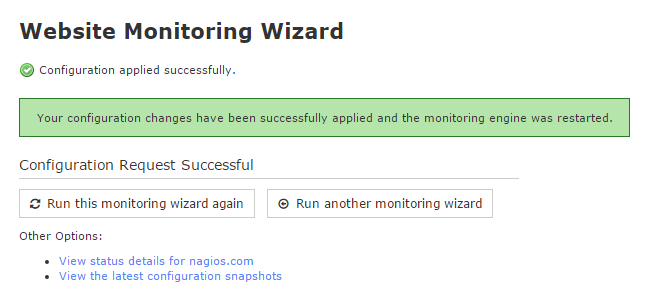
Congratulations! The new devices, services, and applications you chose to monitor with the wizard will now be available in the Nagios XI interface.
To learn more about using the Nagios XI monitoring wizards, please review the document below:
Installing Additional Wizards
Nagios XI comes with standard set of monitoring wizards. Additional wizards can be obtained from the Nagios Exchange website. For information on installing additional wizards, see the documentation below.
Installing Configuration Wizards - XI 2024 & 2026
Installing Configuration Wizards - XI v5 (Legacy)
Using Auto-Discovery In Nagios XI
This document describes how to use Auto-Discovery in Nagios XI to locate hosts and devices that are not already being monitored by Nagios XI.
This document is intended for use by Nagios Administrators who would like to understand how Auto-Discovery works in Nagios XI.
Bulk Host Import Wizard Usage
This document describes how to use the Bulk Host Import Wizard in Nagios XI. It is intended for use by Nagios XI Administrators. The Bulk Host Import wizard allows you to easily import new hosts and services into Nagios XI using a CSV dump. Imported hosts have services that are replicated to match an already existing host the user selects as a template. This import tool is extremely useful for large environments that want to quickly setup several hosts to be monitored in the same manner.
Bulk Renaming Tool
This document describes how to use the Bulk Renaming Tool in the Nagios XI Core Config Manager (CCM). This tool enables you to quickly change the Host/Service Name, Alias, and Display Name of host and service objects in bulk. A huge advantage of this method, versus renaming them via their individual Host/Service Management menus, is that historical performance data will be retained. If objects are renamed outside of this tool, historical data is lost.
Using Nagios Business Process Intelligence (BPI)
Nagios Business Process Intelligence is an advanced grouping tool that allows you to set more complex dependencies to determine groups states. Nagios BPI provides an interface to effectively view the 'real' state of the network. Rules for group states can be determined by the user, and parent-child relationships are easily identified when you need to 'drill down' on a problem. This tool can also be used in conjunction with a check plugin to allow for notifications through Nagios.
This document describes how to fully utilize the Nagios Business Process Intelligence (BPI) component for Nagios XI. This document contains the following instructions:
- BPI Overview
- Installation and Setup for Nagios XI
- The BPI User Interface
- BPI Permissions Summary
- Understanding the BPI Group Logic
- Service Checks for BPI Groups
- Manual configuration, XML Output, and Troubleshooting
This document is intended for use by and Nagios XI Administrators who wish to create "Business Processes" out of hosts and servicesin their monitoring environments.
Core Configuration Manager (CCM)
The Core Configuration Manager provides an advanced interface for managing the Nagios XI monitoring engine.
XI Host Management Using the CCM
This document describes how to manage hosts, host groups, and host templates using the Nagios XI Core Config Manager (CCM). While monitoring wizards make it easy to set up new hosts in Nagios XI, the Core Config Manager allows for more precise control over host monitoring, notifications, and configurations.
CCM Host Management in XI 2024 & 2026
CCM Host Management in XI v5 (Legacy)
XI Service Management Using the CCM
This document describes how to manage services, service groups and service templates using the Nagios XI Core Config Manager (CCM). While monitoring wizards make it easy to set up new services in Nagios XI, the CCM allows for more precise control over service monitoring, notifications, and configurations.
Maintaining Manual Object Configuration Files in Nagios XI
This document is intended to describe how to manually maintain external object configuration files with Nagios® XI™. External object configuration files are object definitions which are processed by Nagios XI but are not maintained or managed using the Nagios XI web GUI or configuration database. External configuration files can be either created from scratch and manually maintained or generated from an external source such as an SVN server. This functionality is useful if you have a large number of static object definitions which you want to monitor with your Nagios XI system but do not need to maintain via Nagios XI.
This document is intended for use by experienced Nagios Administrators who wish to manually manage parts of their Nagios XI configuration, such as host and service definitions.
Nagios XI Notification Variables
This document describes the variables that are available for use in Nagios XI notification messages. Variables allow users to customize notification message to contain the information they feel is most relevant.
Changing Host Alive Check
This document will describe how to change the status check on the host in Nagios XI.
Load Balanced Cloud Host Check Considerations
This document describes important considerations to help you configure reliable host health checks for cloud-hosted endpoints behind managed load balancers.
Load Balanced Cloud Host Check Considrations - XI 2024 & 2026
How To Use Deadpool In Nagios XI
This document will describe how to use the Deadpool feature in Nagios XI.
This document is intended for use by Nagios XI Administrators who want XI to automatically remove failed hosts and/or services from the Nagios monitoring configuration.
How To Use The Generic Wizard In Nagios XI
This document describes how to use the Generic Wizard, which was introduced in Nagios XI 2024R2. This wizard enables you to quickly configure monitoring using custom plugins and commands.
Note that it is designed to execute plugins that reside on your Nagios XI server (though of course those plugins could potentially execute other plugins which reside on the target host).
Using the Negate Plugin
This document is designed to assist Nagios administrators in understanding and using the Negate plugin in Nagios® XI™. The Negate plugin allows for any standard plugin output to be reversed and is very useful with hosts or services that are expected to be in a Critical or Warning state but you wish to show them as OK. This function can be used for the opposite effect (i.e. showing a CRITICAL state when the output is OK).
Using NRDP With Nagios XI
This document describes how to install, configure, and use the NRDP (Nagios Remote Data Processor) addon with either Nagios Core or Nagios XI.
Using the XI Helper
This document explains how to set up and use the Nagios XI Helper (Beta) in Nagios XI 2026R1.2+. The XI Helper is an experimental natural-language interface which you can use to easily start monitoring of websites, NCPA hosts, and SNMP hosts, and to remove all host types from your monitoring configs.
Nagios XI – Understanding User Macros
This document describes how to implement and use User Macros in a working environment. This is useful if you want to obfuscate sensitive information such as usernames and passwords in the Core Config Manager. User macros are also helpful for quickly specifying often-used paths to plugins and event handlers.
This document is intended for use by Nagios XI Administrators that wish to obfuscate arguments that may contain sensitive information.
Nagios XI – Understanding The User Macros Component
This document describes how to use the User Macros component in Nagios XI. The component exposes the user and system macros available in Nagios Core to multiple areas of Nagios XI, allowing for more flexible configurations.
This document is intended for use by Nagios XI Administrators who want to take advantage of user and system macros in Nagios XI.
Using The SNMP Walk Wizard
This document describes how to use the SNMP Walk Wizard, it briefly explains SNMP and how to reference a MIB file or OID. SNMP is the acronym for Simple Network Management Protocol. An SNMP Walk is when the Nagios XI server scans a device to see what SNMP objects are available for monitoring.
This document is intended for use by Nagios Administrators that want to monitor SNMP devices using an SNMP Walk to discover it’s available objects.
Using The SNMP Walk Wizard and Walk Jobs Tool - XI 2024R2.1+
Excluding Hosts And Hostgroups In Nagios XI
This document describes how exclude hosts and host groups in Nagios XI using Core Configuration Manager (CCM).
This document is intended for use by Nagios Administrators who would like an understanding of how to exclude hosts or host groups.
Log Monitoring with Swatch
This document describes how to use the Simple Log Watcher (Swatch) in conjunction with Nagios in order to be notified when certain events are noted in the system log.
Monitoring Hosts Using SSH
This document describes how to monitor hosts with Nagios XI by using SSH to execute monitoring plugins and scripts on remote machines. This document is intended for use by Nagios XI Administrators who want to setup custom monitoring of servers using SSH or who have existing hosts that are already being monitored using SSH.
Monitoring Hosts Using NRPE and NRPE Monitoring Wizard
This document describes how to monitor hosts with Nagios XI by using NRPE and NRPE Monitoring Wizard. This document is intended for use by Nagios XI Administrators who want to setup custom monitoring of servers using NRPE or who have existing hosts with the NRPE agent already installed and configured. This is especially useful to administrators who are migrating from Nagios Core to Nagios XI and are already monitoring Linux/Unix machines using NRPE.
Monitoring Hosts Using NRPE and NRPE Monitoring Wizard - XI 2024 & 2026
Monitoring Hosts Using NRPE and NRPE Monitoring Wizard - XI v5 (Legacy)
Monitoring Linux Using NCPA and Linux Server Monitoring Wizard
This document describes how to monitor Linux hosts with Nagios XI by using NCPA and the Linux Server configuration wizard.
This document is intended for Nagios XI administrators who want to monitor Linux distributions using the NCPA agent, it is tailored specifically for the Linux Server configuration wizard.
Monitoring Linux Using NCPA and Linux Server Monitoring Wizard
Monitoring Linux Using NRPE and Legacy Linux Server Monitoring Wizard
This document describes how to monitor Linux hosts with Nagios XI by using the Nagios Remote Plugin Executor (NRPE) and the Legacy Linux Server configuration wizard.
This document is intended for Nagios XI administrators who want to monitor Linux distributions using the custom Nagios XI NRPE agent, it is tailored specifically for the Legacy Linux Server configuration wizard.
Monitoring Linux Using NRPE and Legacy Linux Server Monitoring Wizard - XI 2024 & 2026
Monitoring Linux Using NRPE and Legacy Linux Server Monitoring Wizard - XI v5 (Legacy)
Monitoring Linux Using SNMP
This document describes how to monitor Linux machines with Nagios XI using SNMP. SNMP is an “agentless” method of monitoring network devices and servers, and is often preferable to installing dedicated agents on target machines.
Monitoring Active Directory with LDAP
This document describes monitoring Active Directory using the Nagios XI LDAP wizard.
Monitoring AIX With Nagios XI
This document describes how to monitor AIX servers using pre-compiled binaries and NRPE. The instructions were contributed by Joshua Whitaker, who successfully configured Nagios to monitor AIX 5.3 servers. Thanks Joshua!
Monitoring AIX With Nagios XI 2024 & 2026
Monitoring AIX With Nagios XI v5
This document describes how to monitor AIX machines with Nagios XI using SNMP. SNMP is an "agentless" method of monitoring network devices and servers, and is often preferable to installing dedicated agents on target machines.
Monitoring Amazon EC2 with Nagios XI
This document describes how to use the Amazon EC2 Configuration Wizard to monitor Amazon EC2 instances.
How To Monitor Amazon EC2 with Nagios XI 2024 & 2026
This document outlines troubleshooting steps for EC2 data monitoring issues.
Monitoring Amazon S3 with Nagios XI
This document describes how to use the Amazon S3 Configuration Wizard to monitor Amazon S3 buckets.
Monitoring Apache ActiveMQ With Nagios XI
This document describes how to use custom Apache ActiveMQ plugins and checks to monitor your Apache ActiveMQ server with Nagios XI. Specifically, this document shows you how to set up Nagios XI to get up to date information on how many objects are in the ActiveMQ server queue.
This document is intended for use by Nagios XI administrators who wish to take advantage of the ability to check the health and vital statistics of their Apache ActiveMQ systems.
Monitoring Apache Tomcat With Nagios XI
This document will cover how to monitor Apache Tomcat servers using the Apache Tomcat wizard and check_tomcat.jar plugin within Nagios XI, so that users may be notified when Java applications are behaving unexpectedly.
This document is intended for use by Nagios XI Administrators who want to monitor their Apache Tomcat instances.
Monitoring Apache Cassandra Distributed Databases
This document describes how to configure Nagios® XI™ to monitor Apache Cassandra distributed database implementations in order to ensure that data, as well as the hardware housing it, is operating properly.
This document is intended for use by Nagios XI Administrators who wish to configure Nagios XI to monitor Apache Cassandra distributed database.
Monitoring Apache Cassandra Databases with Nagios XI 2024 & 2026
Monitoring Apache Cassandra Databases with Nagios XI v5 (Legacy)
Monitoring DHCP Servers
This document describes how to monitor DHCP servers with Nagios XI using the DHCP Wizard.
Monitoring DigitalOcean Droplets
This document describes how to use the DigitalOcean Wizard to monitor droplets using NCPA with Nagios XI.
How To Monitor DigitalOcean Droplets With Nagios XI 2024 & 2026
Monitoring DNS Queries
This document describes how to use the DNS Query Wizard in Nagios XI to monitor DNS resolution and DNS IP match.
Monitoring Docker Containers With Nagios XI
This document describes how to use the Docker Configuration Wizard to monitor your containers' status and resource usage with Nagios XI.
This document is intended for use by Nagios Administrators and end users who want to monitor their Docker containers. Note that at the moment, we do not support Docker for Windows or Docker for Mac. These may be added in a future update.
Monitoring Domain Expiration
This document describes how to use the Domain Expiration Wizard in Nagios XI.
Monitoring Email Delivery
This document describes how to monitor the ability of an account on a mail server to recieve messages using a combination of SMTP and IMAP.
Monitoring FTP Servers With Nagios XI
This document describes how to monitor FTP servers with Nagios XI to verify they are online and functional.
Monitoring a Generic Network Device with Ping
This document describes how to quickly set up a ping check of a network device using the Generic Network Device Wizard
Monitoring GlassFish With Nagios XI
This document will cover how to monitor GlassFish servers using the GlassFish wizard and check_jvm.jar plugin within Nagios XI, so that users may be notified when GlassFish applications are behaving unexpectedly.
This document is intended for use by Nagios XI Administrators who want to monitor their GlassFish instances.
Monitoring JBoss/WildFly With Nagios XI
This document will cover how to monitor JBoss/WildFly servers using the JBoss/WildFly wizard and check_jvm.jar plugin within Nagios XI, so that users may be notified when JBoss/WildFly applications are behaving unexpectedly. For the remainder of this documentation JBoss refers to JBoss or WildFly.
This document is intended for use by Nagios XI Administrators who want to monitor their JBoss instances.
Monitoring JMX With Nagios XI
This document will cover how to monitor java application servers as well as how to configure check_jmx within Nagios® XI™ in order for users to be notified when java applications are not functioning properly.
This document is intended for use by Nagios XI Administrators who wish to monitor JMX applications remotely using JMX.
Monitoring a JSON API
This document describes how to monitor JSON output from an API or URL using the JSON Wizard.
Monitoring Kubernetes With Nagios XI
This document covers how to monitor Kubernetes with Nagios XI using the NCPA agent.
Setting Up Kubernetes for Monitoring With NCPA in XI 2024R2+
Monitoring Kubernetes Clusters With Nagios XI 2024R2+ and NCPA
Monitoring LDAP Servers
This document describes how to verify it is possible to bind to LDAP servers using the LDAP Server Wizard.
Monitoring Linode Instances With Nagios XI
This document covers how to monitor Linode Instances using the NCPA agent with Nagios XI
Monitoring Nagios Log Server Queries with Nagios XI
This document describes how to monitor and alert on Nagios Log Server Queries with Nagios XI.
How to Monitor Log Server Queries with Nagios XI 2024 & 2026
Monitoring Mail Servers with Nagios XI
This document describes how to monitor key services and RBL Blacklist on mail servers with Nagios XI.
Monitoring Meraki Switches
This document covers how to monitor port bandwidth and status on Meraki switches using the Merakin Switch wizard in Nagios XI 2026.
Monitoring a MongoDB Database
This document describes how to monitor MongoDB databases with Nagios XI in order to monitor the number of collections and/or objects in the database, as well as size of the database. The information you collect by monitoring your MongoDB database will help you determine when documents are written into the database or if the size of the database is getting too large.
This document is intended for Nagios Administrators who want to monitor their MongoDB instances with Nagios XI 2014.
How To Monitor MongoDB Database With Nagios XI 2024 & 2026
How To Monitor MongoDB Database With Nagios XI v5 (Legacy)
Monitoring a MongoDB Server
This document describes how to monitor a MongoDB server with Nagios® XI™ using the MongoDB Server Configuration Wizard in order to monitor the health of your server. The wizard supplies checks to monitor the following: number of queries per second, memory usage, the number of databases on the server, and percentage of free connections available.
This document is intended for Nagios Administrators who want to monitor their MongoDB server with Nagios XI 2014.
Monitoring MySQL Servers
This document describes how to monitor database application performance metrics on MySQL DBs using the MySQL Server Wizard in Nagios XI.
How To Monitor MySQL Servers with Nagios XI 2024 & 2026
Monitoring MySQL Queries
This document describes how to monitor the results of custom MySQL DB queries with the MySQL Query Wizard in Nagios XI.
Monitoring Nagiostats
This document describes how to use the Nagiostats Wizard to monitor Nagios engine performance statistics on your local Nagios XI server.
Monitoring A Nagios XI Server
Nagios administrators often need to ensure that their primary monitoring server is operating properly and can reach the Internet to send alert notifications via email and other methods. This document describes how to effectively monitor a primary Nagios XI server from an offsite location to ensure it is both reachable and operating properly.
Monitoring Nutanix CE
This document describes how to use the Nutanix CE wizard in Nagios XI 1.4+ to monitor Nutanix Community Edition cluster, VM, and host metrics via Prism Element.
Monitoring OpenAI Usage With Nagios XI
This document describes how to monitor OpenAI usage using the OpenAI Usage Wizard.
Monitoring Red Hat OpenShift With Nagios XI
This document describes how to set up and use the Red Hat OpenShift Wizard in Nagios XI 2026R1.2+ to monitor metrics such as Node Status and Readiness, Cluster Operators Status, CPU Utilization, and Memory Utilization on OpenShift clusters.
Monitoring Oracle Databases
Oracle Plugin Installation Instructions
This document describes how to install Oracle plugins in Nagios XI and how to configure your environment to utilize the Oracle plugins to monitor Oracle databases with Nagios XI.
Oracle Plugin Installation Instructions - XI 2024 & 2026
Oracle Plugin Installation Instructions - XI v5 (Legacy)
Monitoring Oracle DB Tablespace
This document describes how to monitor tablespace on Oracle databases using the Oracle Tablespace Wizard
Monitoring Oracle DB Tablespace - XI 2024 & 2026
Monitoring Oracle DB Serverspace
This document describes how to monitor serverspace on Oracle databases using the Oracle Serverspace Wizard
Monitoring Oracle DB Serverspace - XI 2024 & 2026
Monitoring Oracle DB Queries
This document describes how to monitor queries on Oracle databases using the Oracle Query Wizard
Monitoring OSX with Nagios XI
This document describes how to monitor OS/X with Nagios XI using the XI Mac OS/X wizard.
Monitoring PostgreSQL Databases and Servers
This document describes how to monitor Postgres servers, databases, and queries using Nagios XI’s built-in Postgres Database, Server, and Query wizards to check metrics such as connection status, table sizes, sequences, backend connections, WAL files, and custom queries.
Monitoring JetDirect Printers
This document describes how to monitor HP JetDirect® compatible printers with Nagios XI using the Printer Wizard.
Monitoring Proxmox VE
This document describes how to use the Proxmox VE configuration wizard in Nagios XI 2026R1.3+ to monitor server/cluster and virtual machine/container metrics such as CPU, Memory, and Storage Usage, Backup Status, Cluster Health, Log Errors, and Task Errors.
Monitoring Prometheus Exporters with Nagios XI
This document describes how to install the Prometheus exporters on Linux and Windows systems, and how to monitor them using the Prometheus Wizard.
Monitoring Rackspace Cloud Servers with Nagios XI
This document describes how to monitor Rackspace cloud servers with Nagios XI using the NCPA agent.
Monitoring RADIUS Servers
This document describes how to monitor RADIUS servers with Nagios XI using the RADIUS Server Wizard.
Monitoring Service Level Agreements (SLAs)
This document describes how to monitor whether you are meeting SLAs with Nagios XI Using the SLA Wizard.
Monitoring SNMP OIDs
This document describes how to monitor SNMP Object IDs using the SNMP Wizard in Nagios XI.
Monitoring SNMP Traps
This document describes how to configure Nagios XI to receive and process SNMP traps from external devices.
Integrating SNMP Traps in Nagios XI
This document explains how to use the Nagios XI SNMP Trap Interface (NXTI) to monitor and manage incoming SNMP Traps.
Monitoring Solaris Using NCPA
This document describes how to monitor Solaris 11.4 (x86 & SPARC) with Nagios XI using the NCPA agent and the Solaris Wizard.
How To Monitor Solaris using NCPA with Nagios XI 2024 & 2026
Monitoring Switches and Routers
These documents explain how to use the Nagios XI Network Switch/Router wizards to monitor services like Port Status and Port Bandwidth via SNMP.
The updated wizard in XI 2026 uses more efficient checks, new plugins, and creates throughput checks compatible with Nagios Mod-Gearman workers:
Using the Network Switch/Router Wizard in XI 2026
The Legacy wizard remains available as well:
Using the Network Switch/Router Wizard (Legacy) in XI 2024/2026
This video explains how to easily monitor switches and routers via SNMP using the Network Switch/Router (Legacy) wizard.
Monitoring Switches and Routers with Nagios XI 2024 & 2026
This article explains the architecture of the Switch/Router Wizard (Legacy).
Monitoring TCP/UDP Ports
This document describes how to monitor custom and common TCP & UDP Ports with Nagios XI using the TCP/UDP Port wizard.
Monitoring TFTP Servers
This document describes how to monitor connections and specific files on TFTP servers with Nagios XI using the TFTP Wizard.
Monitoring VMware with Nagios XI
This document describes how to use Nagios XI to monitor VMware ESX, ESXi, vSphere, and vCenter Server with the VMware monitoring wizard. This document will show you how to set up your Nagios XI system to monitor virtual machines (VMs) deployed on these products.
Monitoring VMware with Nagios XI 2026R1.2+
Monitoring VMware with Nagios XI 2024 to 2026R1.1.1
Monitoring VMware with Nagios XI 5 (Legacy VMware SDK Method)
Monitoring WatchGuard with Nagios XI
This document describes how to setup your WatchGuard device and your Nagios XI server to allow for quick and easy monitoring of your WatchGuard device.
How To Monitor WebLogic With Nagios XI
This document will cover how to monitor WebLogic servers using the WebLogic wizard with Nagios XI, so that users may be notified when WebLogic applications are behaving unexpectedly.
This document is intended for use by Nagios XI Administrators who want to monitor their WebLogic instances.
Monitoring Environmental Conditions With Nagios XI And A Websensor EM08
This document describes how to monitor environmental conditions (temperature, relative humidity, and light level) with Nagios XI and a Websensor EM08 from eSensors. Using Nagios XI to monitor a Websensor EM08 will notify you of environmental element changes which may impact your IT infrastructure.
Monitoring Websites With Nagios XI
This document describes how to monitor websites effectively with Nagios XI. Website monitoring includes HTTP response validity, DNS resolution, IP address match, website content, SSL certificates, domain expiration, and web transactions.
Monitoring Website Defacement With Nagios XI
This document describes how use the Website Defacement Wizard to monitor your websites for defacement, modification and malicious insertions with Nagios® XI™. The Website Defacement Wizard provides an automated method for monitoring your website for defacement, and notifies you when your website contains undesirable content.
This document is intended for use by Nagios XI Administrators and end-users who want to monitor their websites for defacement
Monitoring Website Defacement With Nagios XI 2024 & 2026
Monitoring Website Defacement With Nagios XI v5 (Legacy)
Monitoring XCP-ng / Vates Virtual Machine Server
This document describes how to use the XCP-ng / Vates VMS Wizard in Nagios XI 2026R1.5+ to monitor pool master metrics such as pool health and VDI usage, as well as VM and Host metrics such as CPU, Disk I/O, and status.
Monitoring XML APIs
This document describes how to monitor output from an XML URL or API with Nagios XI using the XML Wizard.
Passive checks
Configuring Passive Services In Nagios XI
This document describes how to configure passive service checks in Nagios XI. Passive checks are useful when you want to receive and process data (such as security alerts and log events) from external applications.
Configuring Passive Services In Nagios XI 2024 & 2026
Configuring Passive Services In Nagios XI v5 (Legacy)
Monitoring Unconfigured Objects With Nagios XI
Passive check results for hosts and services that are submitted to Nagios by external agents and application using the NSCA or NRDP APIs are not processed by the monitoring engine until they are configured in Nagios XI. This document describes how to configure monitoring of previously unconfigured hosts and services that a Nagios XI server has received passive check results for.
Monitoring Unconfigured Objects With Nagios XI 2024 & 2026
Monitoring Unconfigured Objects With Nagios XI v5 (Legacy)
Using NCPA For Passive Checks
This document explains how to configure NCPA version 3 to send passive check results to Nagios XI or Nagios Core using the Nagios Remote Data Processor (NRDP).
Using NSCA With Nagios XI
This document describes how to enable and use the NSCA (Nagios Service Check Adapter) addon with Nagios XI to allow remote Nagios servers and applications to send passive host and service check results to a Nagios XI server for processing.
Using NSCA With Nagios XI 2024 & 2026
Using NSCA With Nagios XI v5 (Legacy)
Passive Monitoring with NRDS
Nagios Remote Data Sender, or NRDS is a component installed on a Nagios XI server that allows the administrator to create and manage configurations and plugins to be deployed with a passive agent that can be installed on a variety of operating systems. The passive agents downloads the current configuration and the required plugin from the Nagios XI server and run the checks and posting the results to the XI server.